
Build your own cheap but powerful self-hosted cluster and be free from any SaaS solutions by following this opinionated guide 🎉
This is the Part V of more global topic tutorial. Back to first part for intro.
Note
This part is totally optional, as it’s mainly focused on monitoring. Feel free to skip this part.
Metrics with Prometheus 🔦
Prometheus became the standard de facto for self-hosted monitoring in part thanks to its architecture. It’s a TSDB (Time Series Database) that will poll (aka scrape) standard metrics REST endpoints, provided by the tools to monitor. It’s the case of Traefik, as we have seen in part III. For tools that don’t support it natively, like databases, you’ll find many exporters that will do the job for you.
Prometheus install 💽
I’ll not use GlusterFS volume for storing Prometheus data, because :
- 1 prometheus instance needed on the master
- No critical data, it’s just metrics
- No need of backup, as it can be pretty huge
First go to the manager-01 node settings in Portainer inside Swarm Cluster overview, and apply a new label that indicates that this node is the host of Prometheus data.
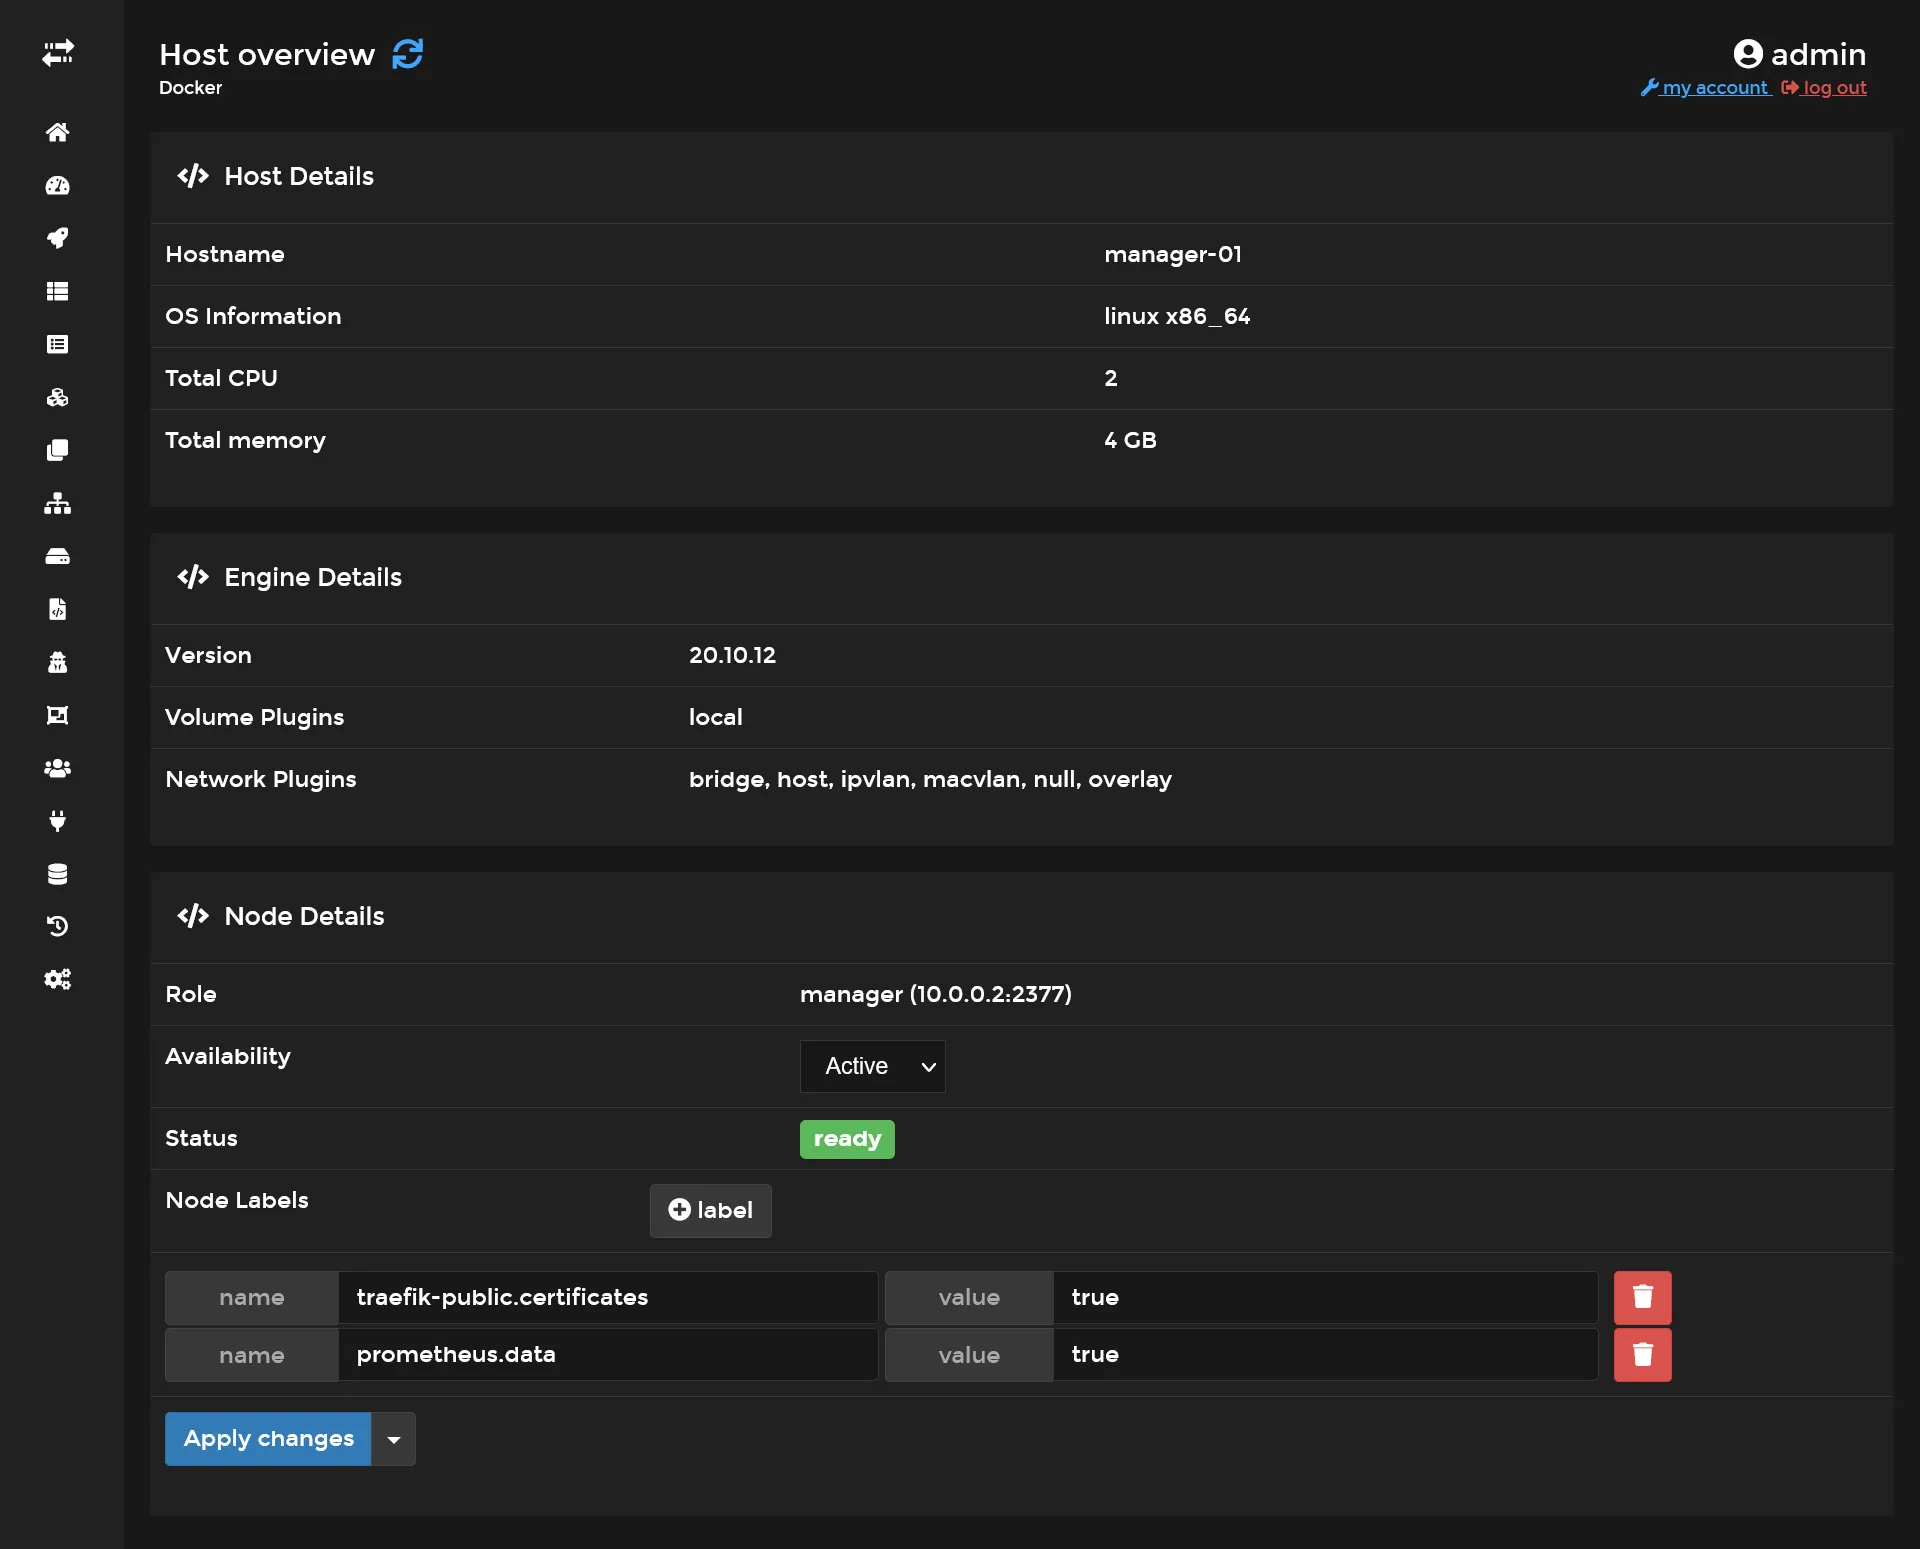
It’s equivalent of doing :
docker node update --label-add prometheus.data=true manager-01Then create following config file :
global: scrape_interval: 5s
scrape_configs: - job_name: "prometheus" static_configs: - targets: ["localhost:9090"]
- job_name: "traefik" static_configs: - targets: ["traefik_traefik:8080"]It consists on 2 scrapes job, use targets in order to indicate to Prometheus the /metrics endpoint locations. I configure 5s as interval, that means Prometheus will scrape /metrics endpoints every 5 seconds.
Finally create next stack in Portainer :
version: '3.8'
services:
prometheus: image: prom/prometheus networks: - private - traefik_public command: - --config.file=/etc/prometheus/prometheus.yml - --storage.tsdb.retention.size=5GB - --storage.tsdb.retention.time=15d volumes: - /etc/hosts:/etc/hosts - /etc/prometheus/prometheus.yml:/etc/prometheus/prometheus.yml - data:/prometheus deploy: placement: constraints: - node.labels.prometheus.data == true labels: - traefik.enable=true - traefik.http.routers.prometheus.entrypoints=https - traefik.http.routers.prometheus.middlewares=admin-ip,admin-auth - traefik.http.services.prometheus.loadbalancer.server.port=9090
networks: private: traefik_public: external: true
volumes: data:The private network will serve us later for exporters. Next config are useful in order to control the DB usage, as metrics can go up very quickly :
| argument | description |
|---|---|
storage.tsdb.retention.size | The max DB size |
storage.tsdb.retention.time | The max data retention date |
Deploy it and https://prometheus.sw.dockerswarm.rocks should be available after few seconds. Use same traefik credentials for login.
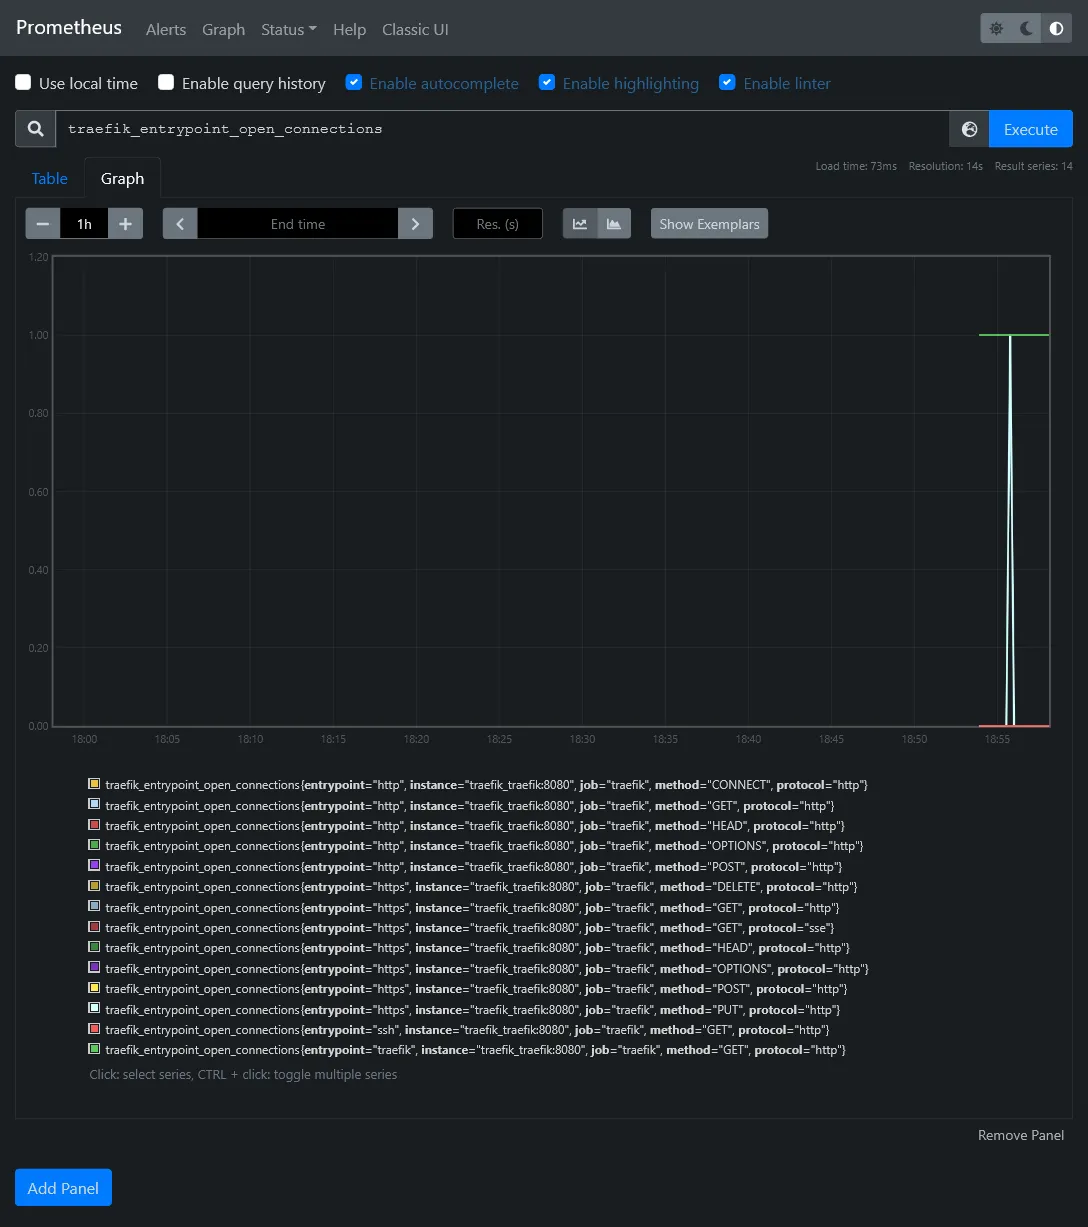
You should now have access to some metrics !
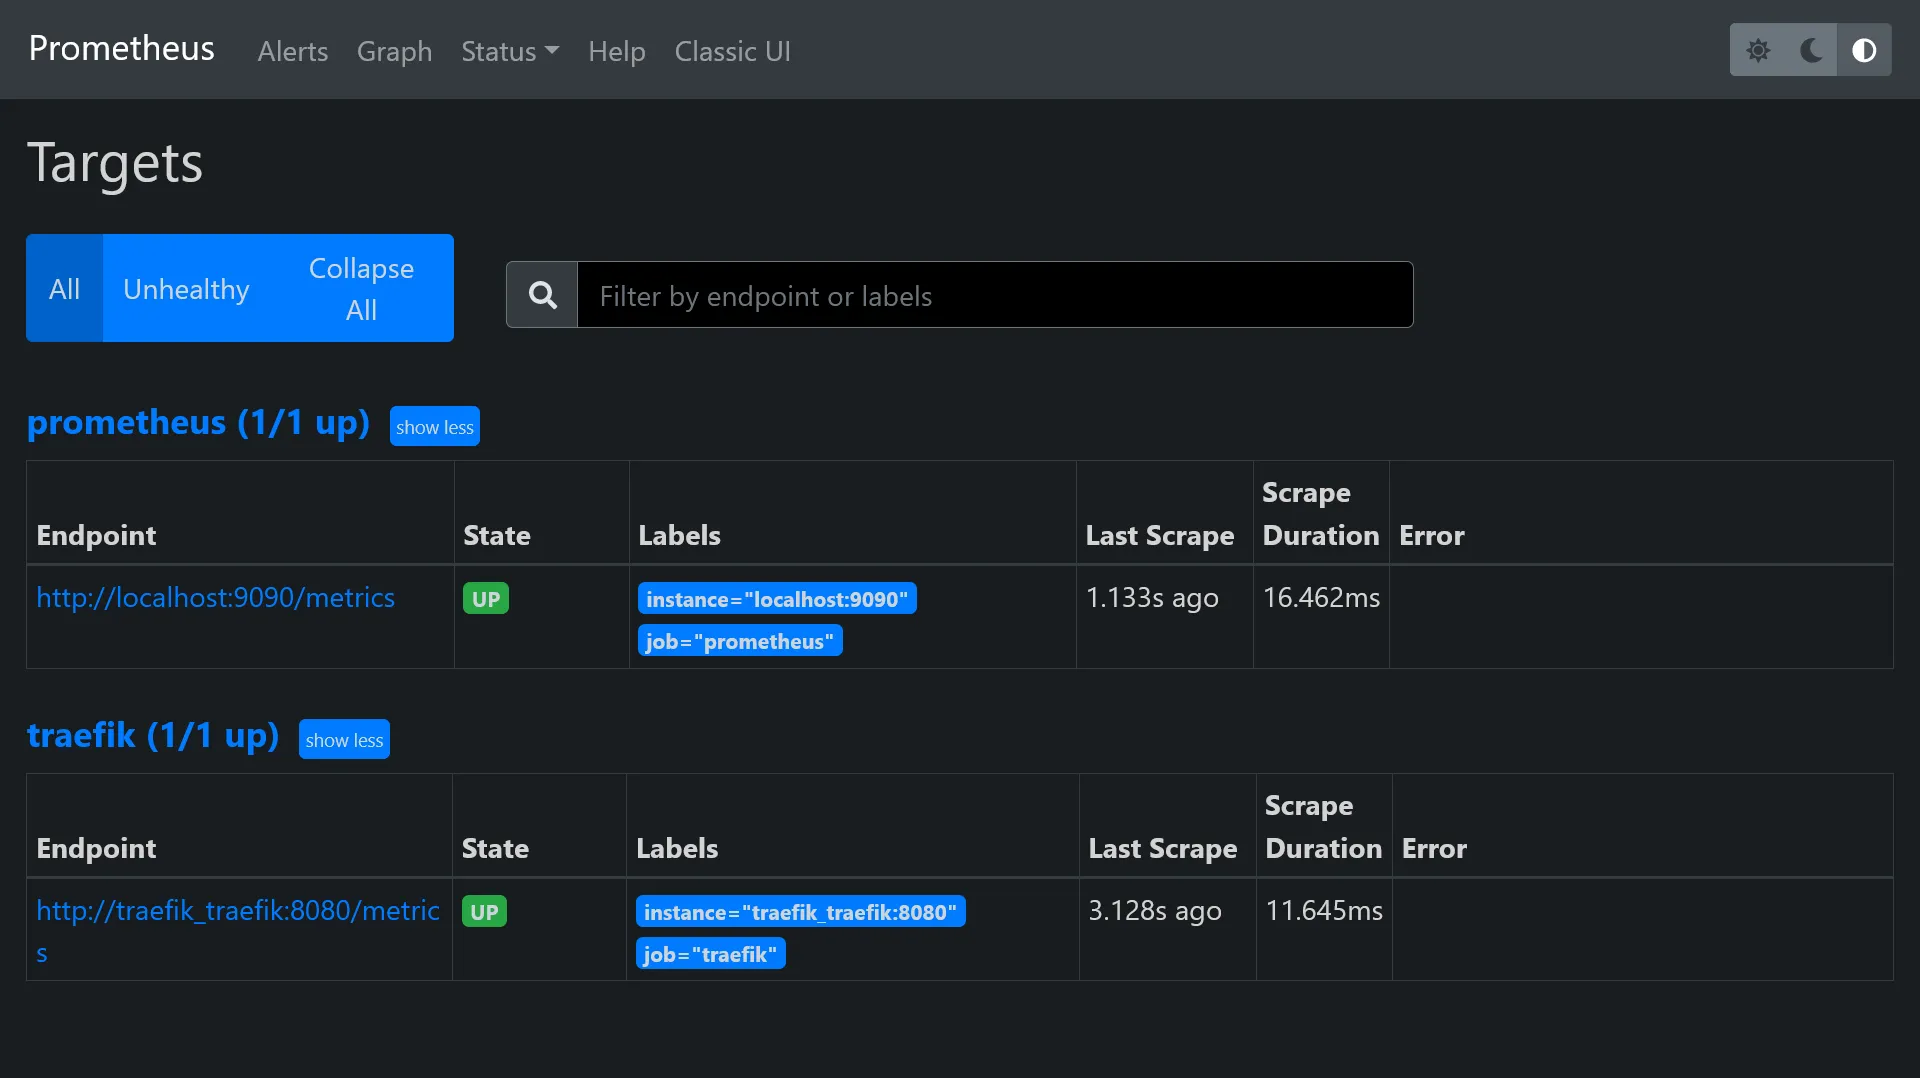
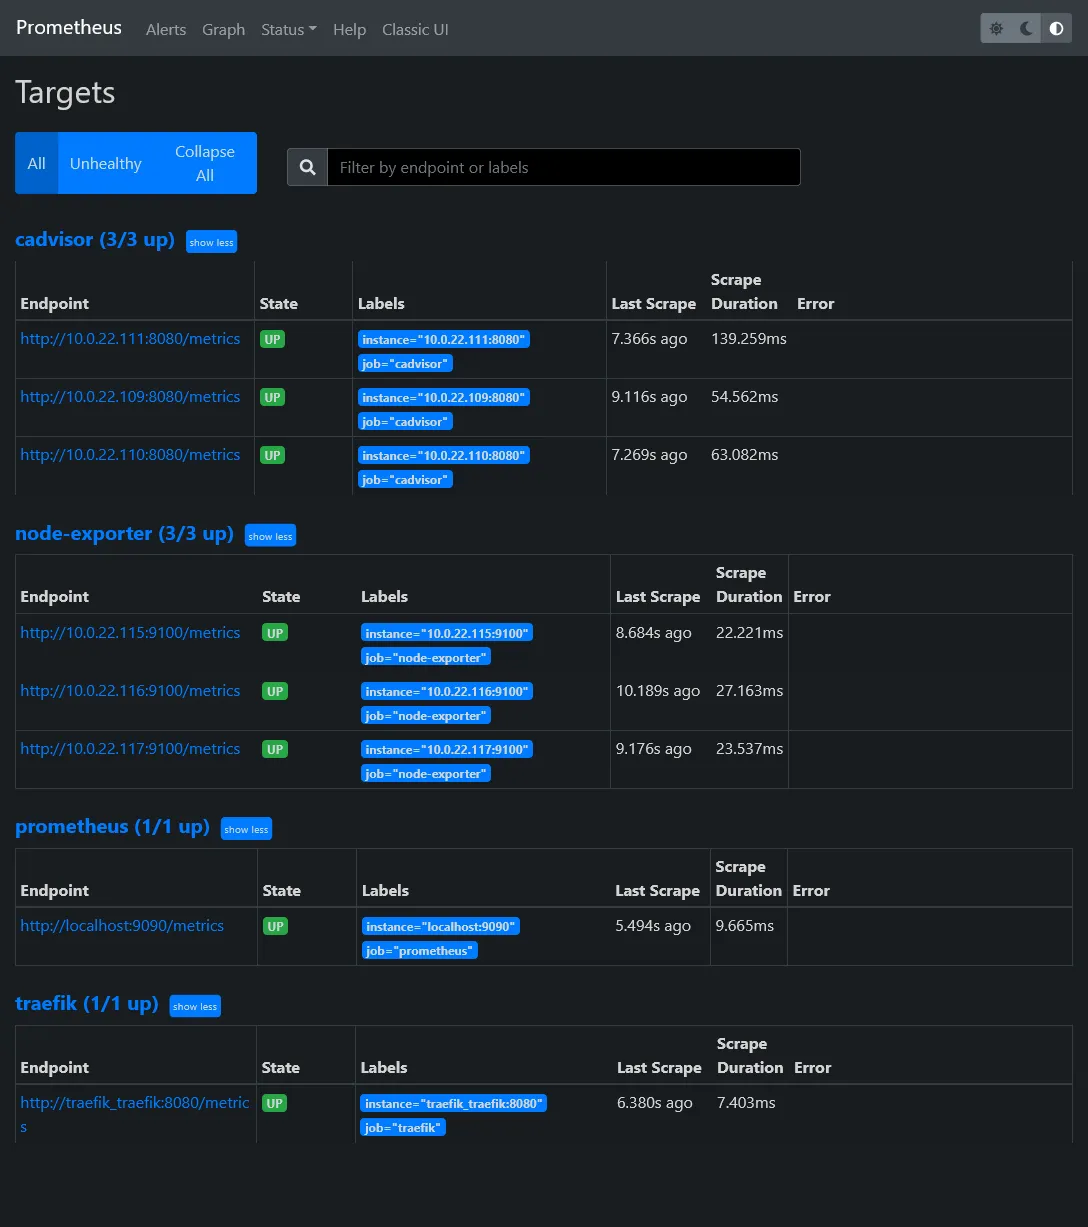
In Status > Targets, you should have 2 endpoints enabled, which correspond to above scrape config.
Get cluster metrics
We have the monitor brain, now it’s time to have some more relevant metrics data from all containers as well as docker nodes. Its doable thanks to exporters.
- cAdvisor from Google which scrape metrics of all running containers
- Node exporter for more global node (aka host) level metrics
Before edit above stack, we need to make a specific docker entry point for node exporter that will help us to fetch the original hostname of the docker host machine name. This is because we run node exporter as docker container, which have no clue of original node hostname.
Besides this node exporter (like cAdvisor) work as an agent which must be deployed in global mode. In order to avoid have a file to put on each host, we’ll use the config docker feature availabe in swarm mode.
Go to Configs menu inside Portainer and add a node_exporter_entrypoint config file with next content :
#!/bin/sh -e
NODE_NAME=$(cat /etc/nodename)echo "node_meta{node_id=\"$NODE_ID\", container_label_com_docker_swarm_node_id=\"$NODE_ID\", node_name=\"$NODE_NAME\"} 1" > /home/node-meta.prom
set -- /bin/node_exporter "$@"
exec "$@"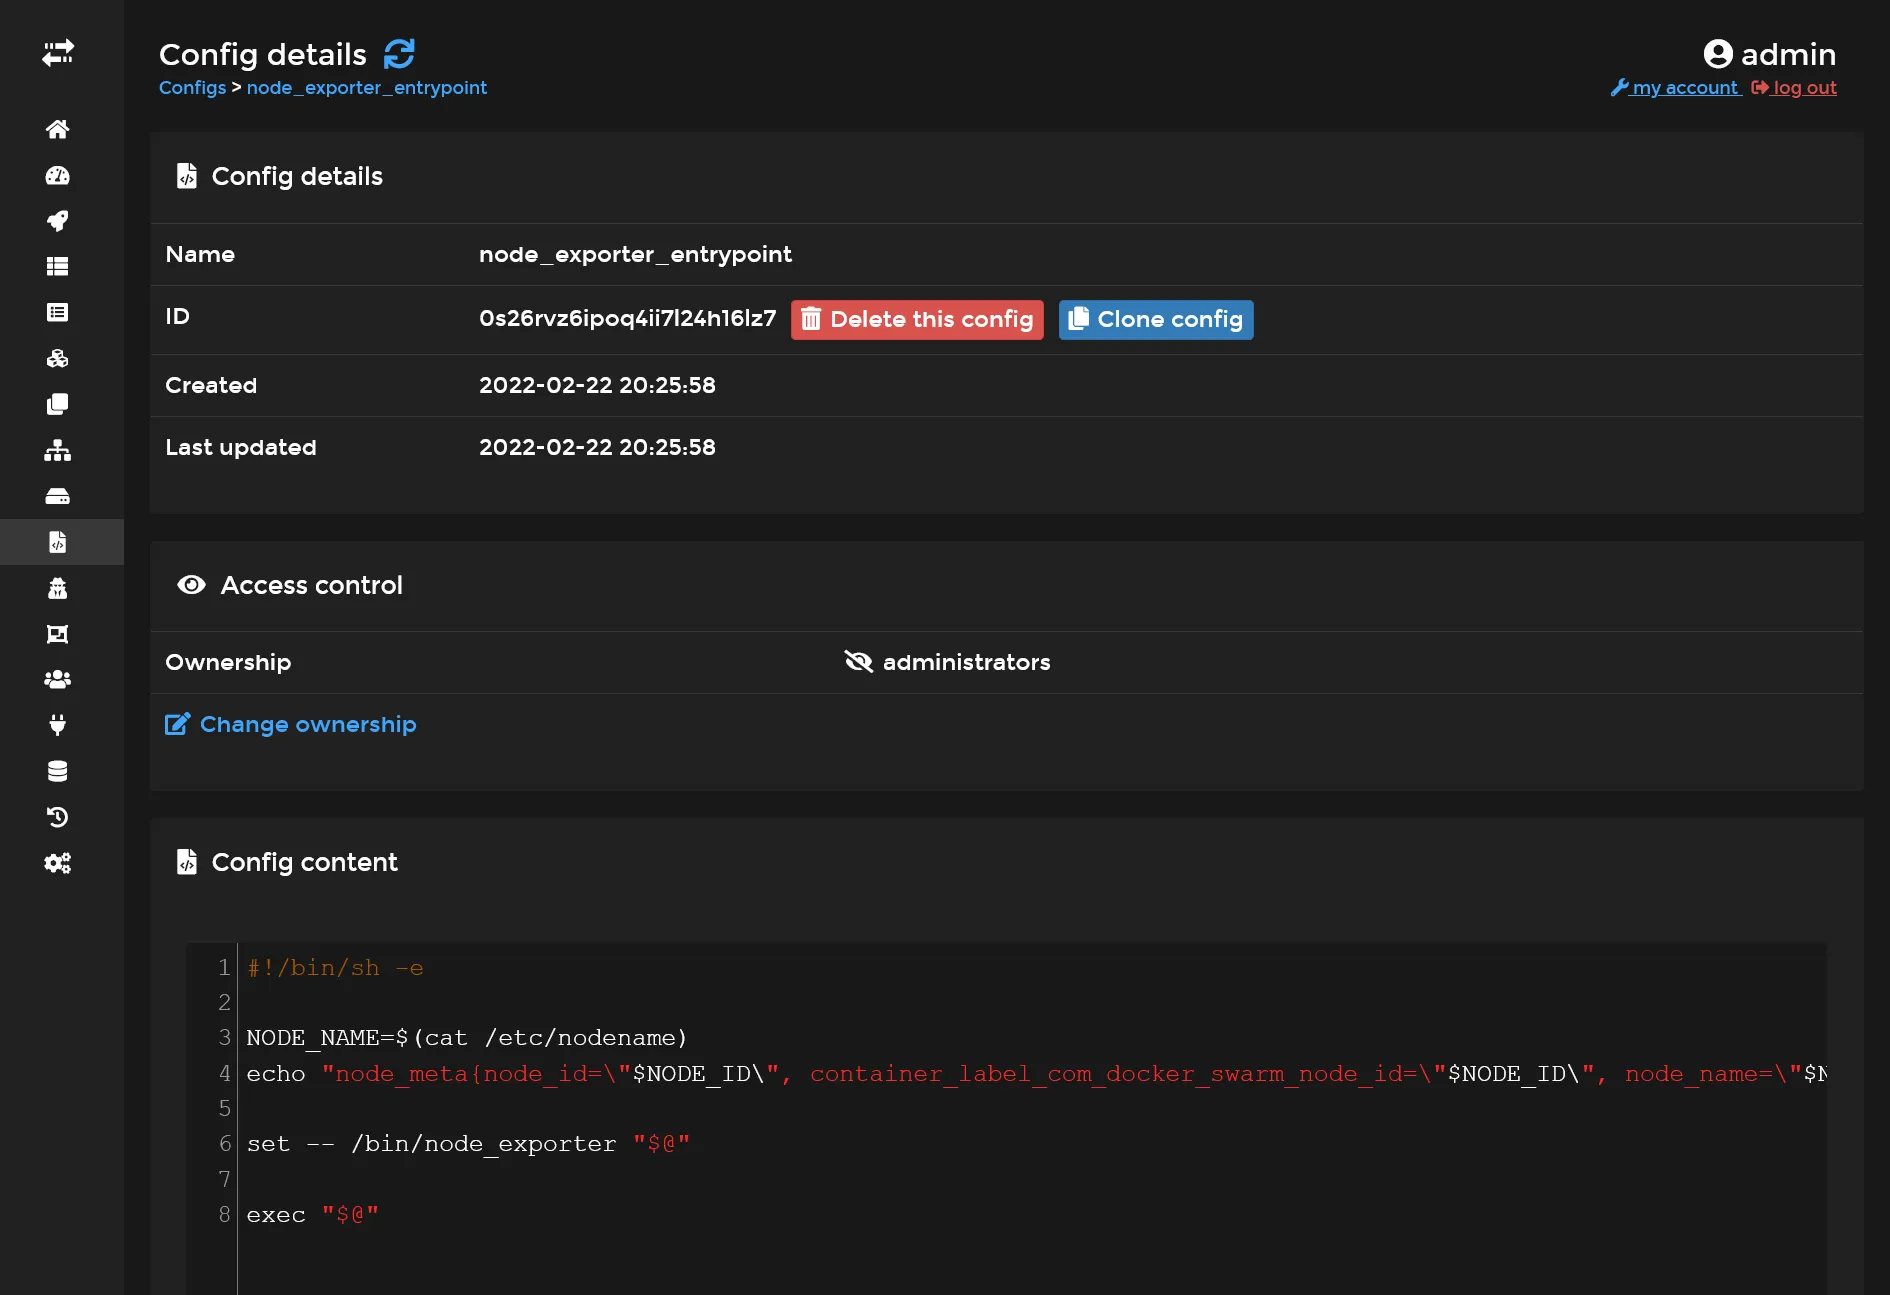
It will take the node hostname and create an exploitable data metric for prometheus.
Next we’ll edit our prometheus stack by expanding YML config with 2 additional services :
#... cadvisor: image: gcr.io/cadvisor/cadvisor:v0.39.3 volumes: - /:/rootfs:ro - /var/run:/var/run:rw - /sys:/sys:ro - /var/lib/docker/:/var/lib/docker:ro networks: - private command: - --docker_only - --housekeeping_interval=5s - --disable_metrics=disk,diskIO,tcp,udp,percpu,sched,process deploy: mode: global
node-exporter: image: quay.io/prometheus/node-exporter:latest environment: - NODE_ID={{.Node.ID}} networks: - private volumes: - /:/host:ro,rslave - /etc/hostname:/etc/nodename command: - --collector.textfile.directory=/home configs: - source: node_exporter_entrypoint target: /docker-entrypoint.sh entrypoint: - /bin/sh - /docker-entrypoint.sh deploy: mode: global#...
# Don't forget to add this lines in the end !configs: node_exporter_entrypoint: external: trueFinally, add the 2 next jobs in previous Prometheus config file :
#... - job_name: "cadvisor" dns_sd_configs: - names: - "tasks.cadvisor" type: "A" port: 8080
- job_name: "node-exporter" dns_sd_configs: - names: - "tasks.node-exporter" type: "A" port: 9100#...The tasks.* is a specific DNS from specific to Docker Swarm which allows multiple communication at once when using global mode, similarly as tcp://tasks.agent:9001 for Portainer.
You need to restart Prometheus service in order to apply above config.
Go back to the Prometheus targets UI in order to confirm the apparition of 2 new targets.
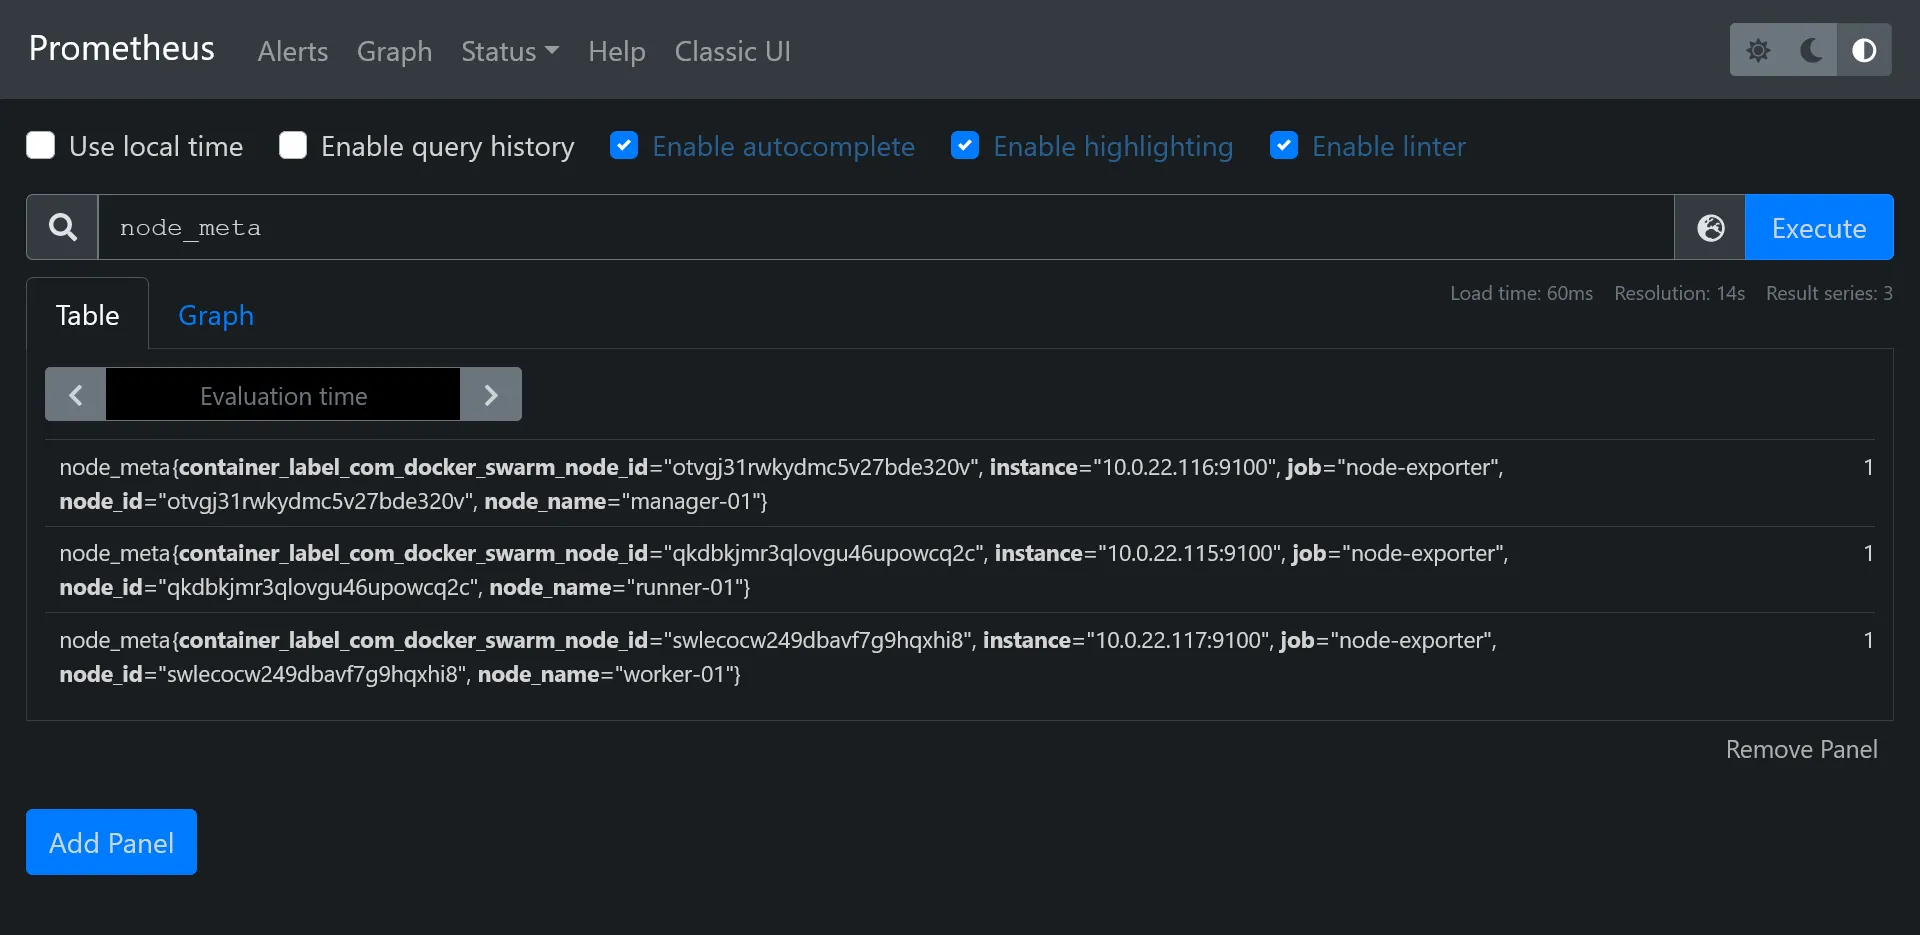
Confirm you fetch the node_meta metric with proper hostnames :
Visualization with Grafana 📈
Okay so now we have plenty metrics from our cluster and containers, but Prometheus UI Graph is a bit rude to use. It’s time to go to the next level.
Redis
Before install Grafana, let’s quickly install a powerful key-value database cache on data-01 :
sudo add-apt-repository ppa:redislabs/redissudo apt install -y redis-serversudo systemctl enable redis-server.serviceNow, let’s enable remote connections by disabling protected-mode and local bind address.
# bind 127.0.0.1 -::1protected-mode noLet’s test it quickly from manager-01 :
sudo add-apt-repository ppa:redislabs/redissudo apt install -y redis-toolsredis-cli -h data-01Grafana install 💽
As always, it’s just a Swarm stack to deploy ! Like N8N, we’ll use a proper real production database and production cache.
First connect to pgAdmin and create new grafana user and database. Don’t forget to tick Can login? in Privileges tab, and set grafana as owner on database creation.
Create storage folder with :
sudo mkdir /mnt/storage-pool/grafanasudo chown -R 472:472 /mnt/storage-pool/grafanaNext create new following stack :
version: '3.8'
services: grafana: image: grafana/grafana:latest environment: GF_SERVER_DOMAIN: grafana.sw.dockerswarm.rocks GF_SERVER_ROOT_URL: https://grafana.sw.dockerswarm.rocks GF_DATABASE_TYPE: postgres GF_DATABASE_HOST: data-01:5432 GF_DATABASE_NAME: grafana GF_DATABASE_USER: grafana GF_DATABASE_PASSWORD: GF_REMOTE_CACHE_TYPE: redis GF_REMOTE_CACHE_CONNSTR: addr=data-01:6379,pool_size=100,db=0,ssl=false volumes: - /etc/hosts:/etc/hosts - /mnt/storage-pool/grafana:/var/lib/grafana networks: - traefik_public deploy: labels: - traefik.enable=true - traefik.http.routers.grafana.entrypoints=https - traefik.http.routers.grafana.middlewares=admin-ip - traefik.http.services.grafana.loadbalancer.server.port=3000 placement: constraints: - node.role == manager
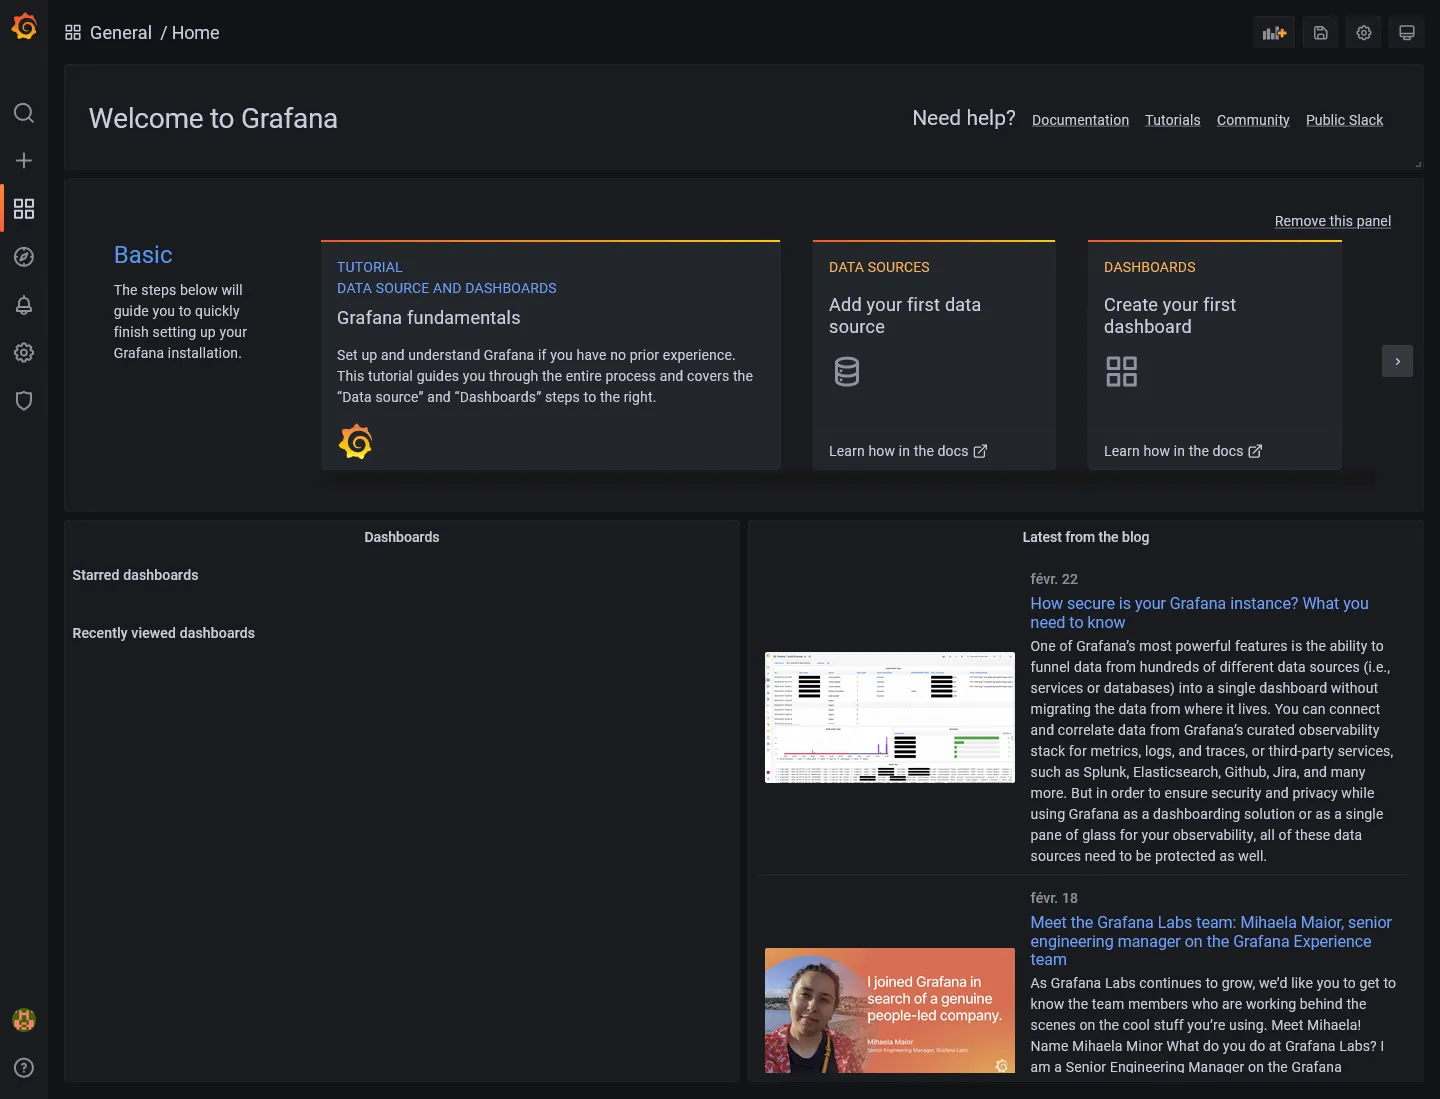
networks: traefik_public: external: trueSet proper GF_DATABASE_PASSWORD and deploy. Database migration should be automatic (don’t hesitate to check inside pgAdmin). Go to https://grafana.sw.dockerswarm.rocks and login as admin / admin.
Docker Swarm dashboard
For best show-case scenario of Grafana, let’s import an existing dashboard suited for complete Swarm monitor overview.
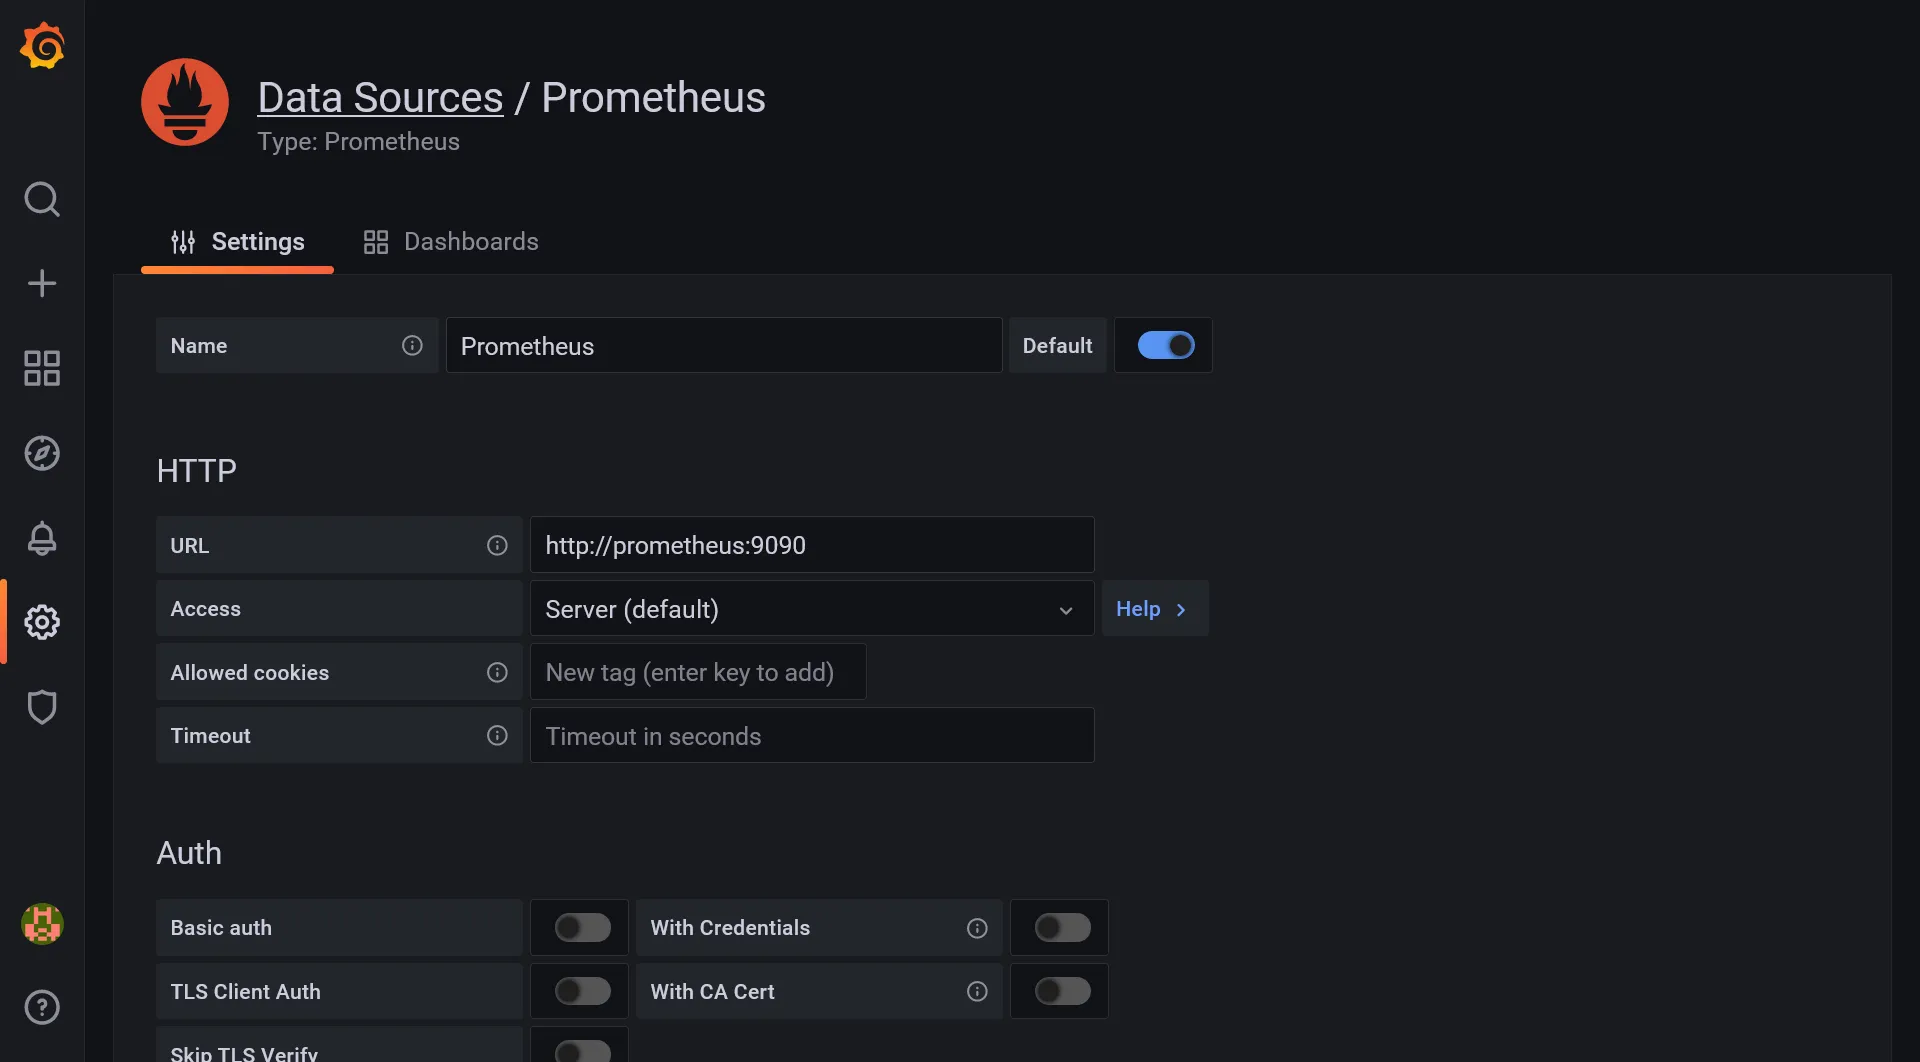
First we need to add Prometheus as main metrics data source. Go to Configuration > Data source menu and click on Add data source. Select Prometheus and set the internal docker prometheus URL, which should be http://prometheus:9090. A successful message should appear when saving.
Then go to Create > Import, load 11939 as dashboard ID, and select Prometheus source and woha!
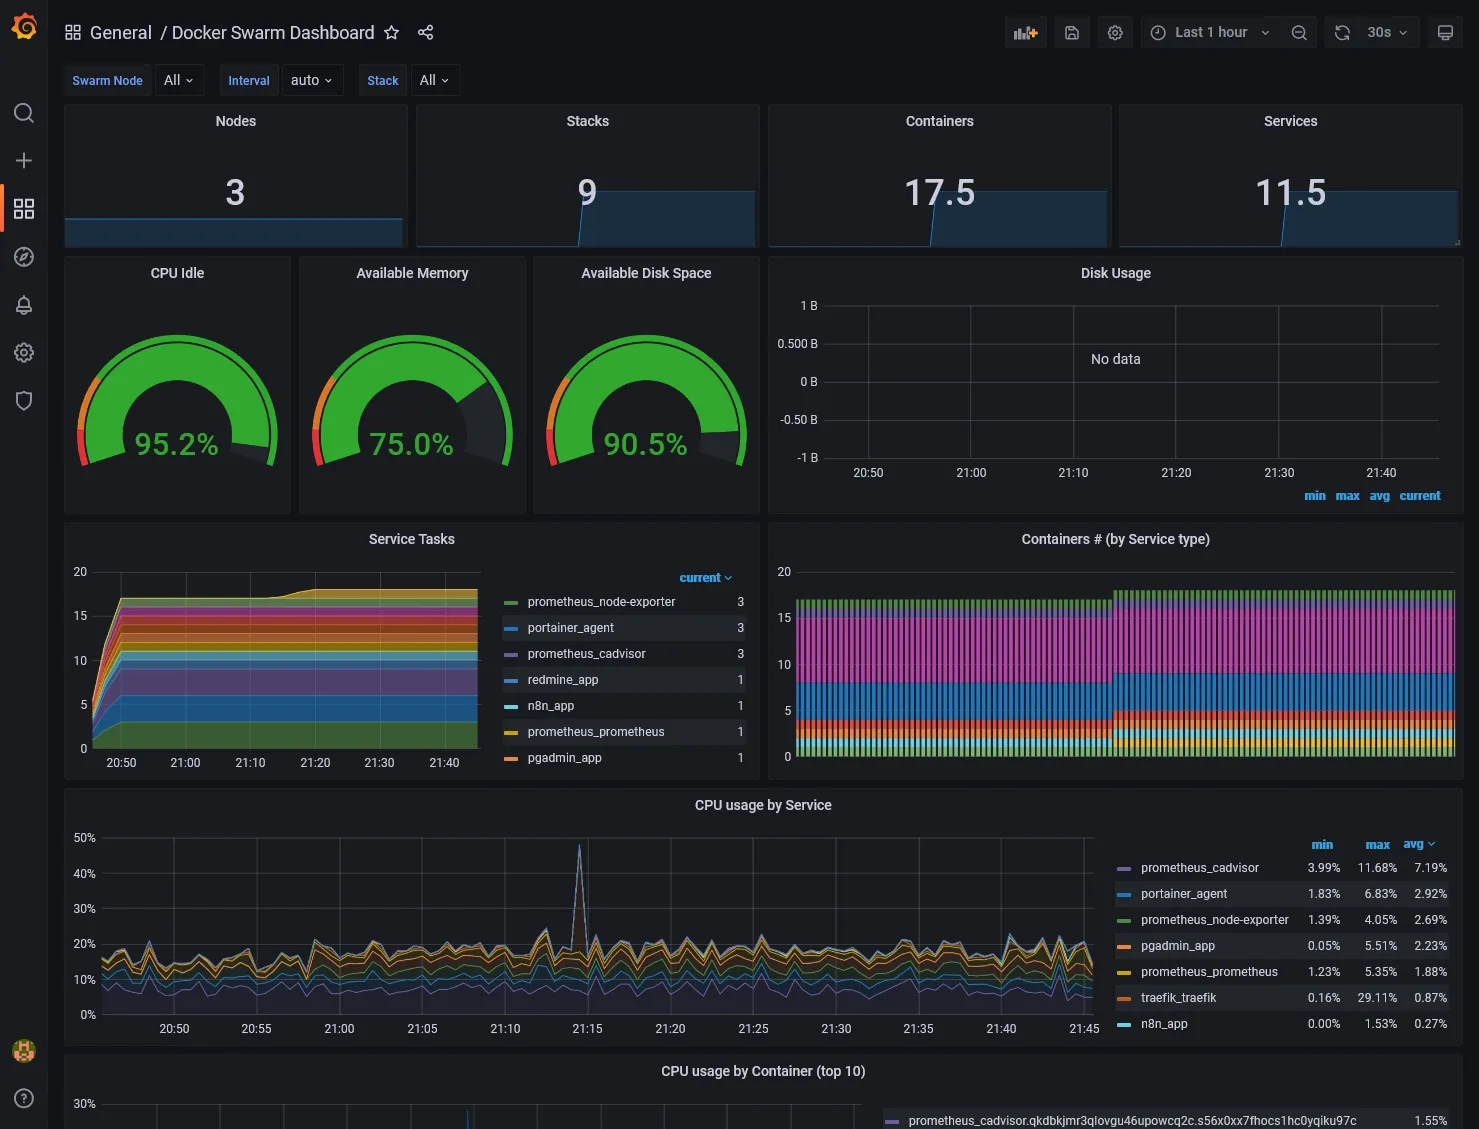
The Available Disk Space metrics card should indicate N/A because not properly configured for Hetzner disks. Just edit the card and change the PromQL inside Metrics browser field by replacing device="rootfs", mountpoint="/" by device="/dev/sda1", mountpoint="/host".
External node, MySQL and PostgreSQL exports
We have done for the cluster metrics part but what about the external data-01 host and databases ? Just more exporters of course !
Node exporter for data
For node exporter, we have no other choice to install it locally as a service binary, so we must go through old fashion install.
wget https://github.com/prometheus/node_exporter/releases/download/v1.3.1/node_exporter-1.3.1.linux-amd64.tar.gztar xzf node_exporter-1.3.1.linux-amd64.tar.gzrm node_exporter-1.3.1.linux-amd64.tar.gzsudo mv node_exporter-1.3.1.linux-amd64/node_exporter /usr/local/bin/rm -r node_exporter-1.3.1.linux-amd64/Create a new systemd file service :
[Unit]Description=Node Exporter
[Service]Type=simpleExecStart=/usr/local/bin/node_exporter
[Install]WantedBy=default.targetThen enable the service and check status :
sudo systemctl enable node-exporter.servicesudo systemctl start node-exporter.servicesudo systemctl status node-exporter.serviceExporter for databases
For MySQL, we need to create a specific exporter user. Do sudo mysql and execute following SQL (replace *** by your password) :
CREATE USER 'exporter'@'10.0.0.0/8' IDENTIFIED BY '***' WITH MAX_USER_CONNECTIONS 3;GRANT PROCESS, REPLICATION CLIENT, SELECT ON *.* TO 'exporter'@'10.0.0.0/8';Then we just have to expand the above prometheus stack description with 2 new exporter services, one for MySQL, and other for PostgreSQL :
#... mysql-exporter: image: prom/mysqld-exporter environment: DATA_SOURCE_NAME: exporter:${MYSQL_PASSWORD}@(data-01:3306)/ networks: - private volumes: - /etc/hosts:/etc/hosts deploy: placement: constraints: - node.role == manager
postgres-exporter: image: quay.io/prometheuscommunity/postgres-exporter environment: DATA_SOURCE_URI: data-01:5432/postgres?sslmode=disable DATA_SOURCE_USER: swarm DATA_SOURCE_PASS: ${POSTGRES_PASSWORD} networks: - private volumes: - /etc/hosts:/etc/hosts deploy: placement: constraints: - node.role == manager#...Set proper MYSQL_PASSWORD and POSTGRES_PASSWORD environment variables and deploy the stack. Be sure that the 2 new services have started.
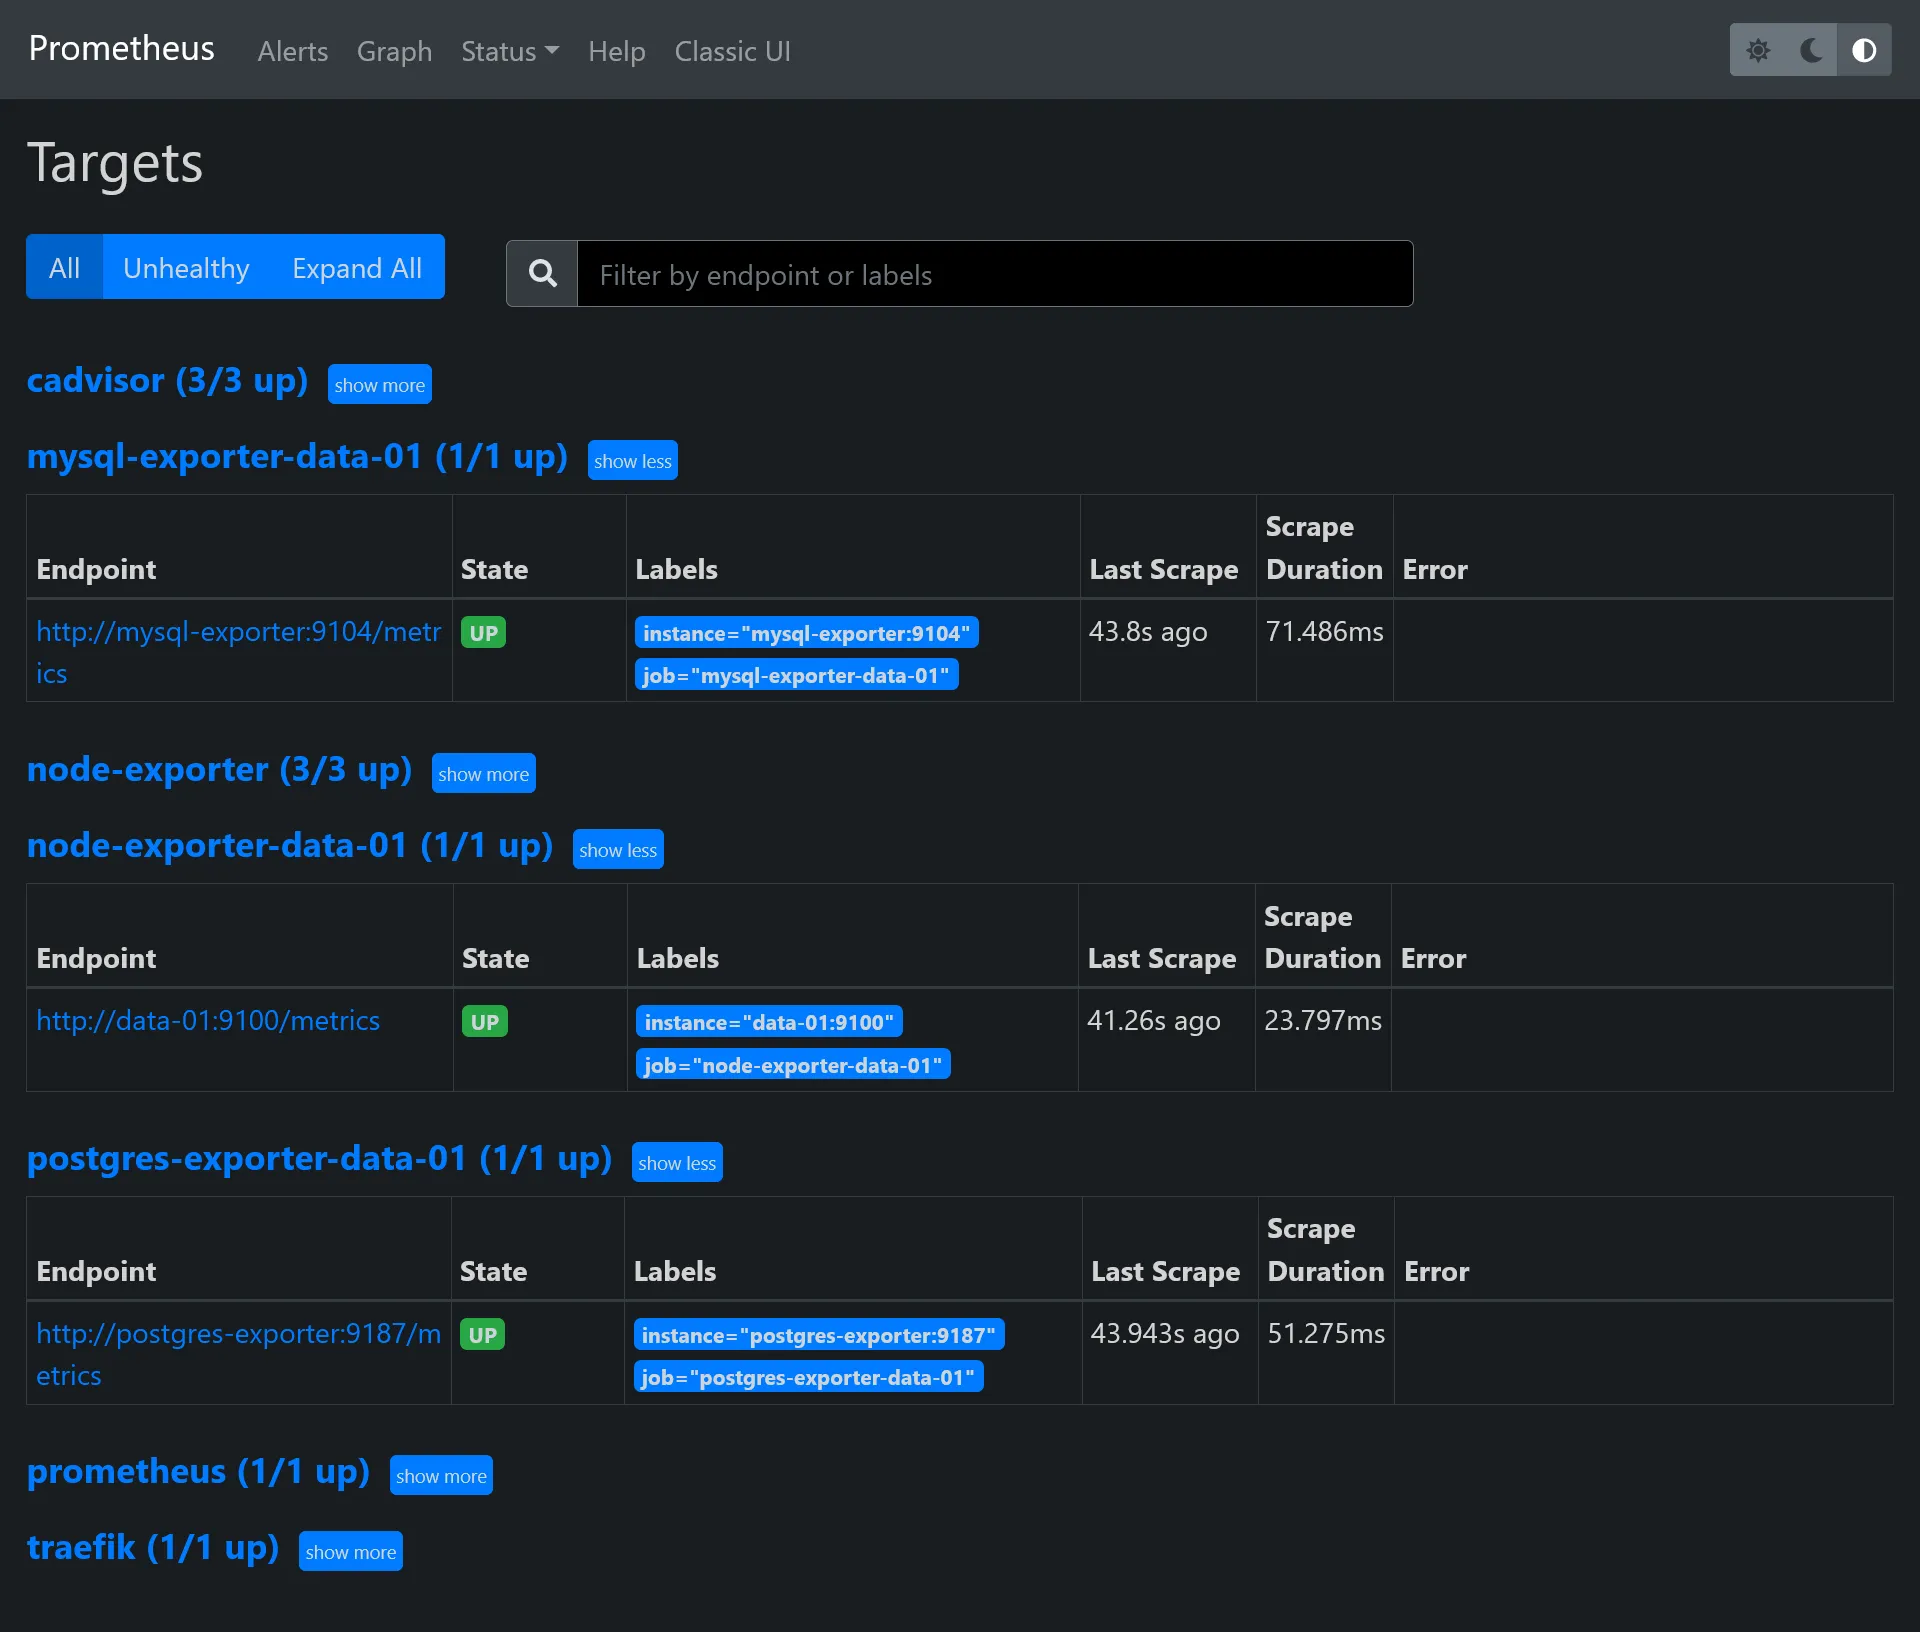
Configure Prometheus
Expand the prometheus config with 3 new jobs :
#...- job_name: "node-exporter-data-01" static_configs: - targets: ["data-01:9100"]
- job_name: "mysql-exporter-data-01" static_configs: - targets: ["mysql-exporter:9104"]
- job_name: "postgres-exporter-data-01" static_configs: - targets: ["postgres-exporter:9187"]#...Then restart Prometheus service and go back to targets to check you have all new data-01 endpoints.
Grafana dashboards for data
Now it’s time to end this by some new optimized dashboards for data metrics !
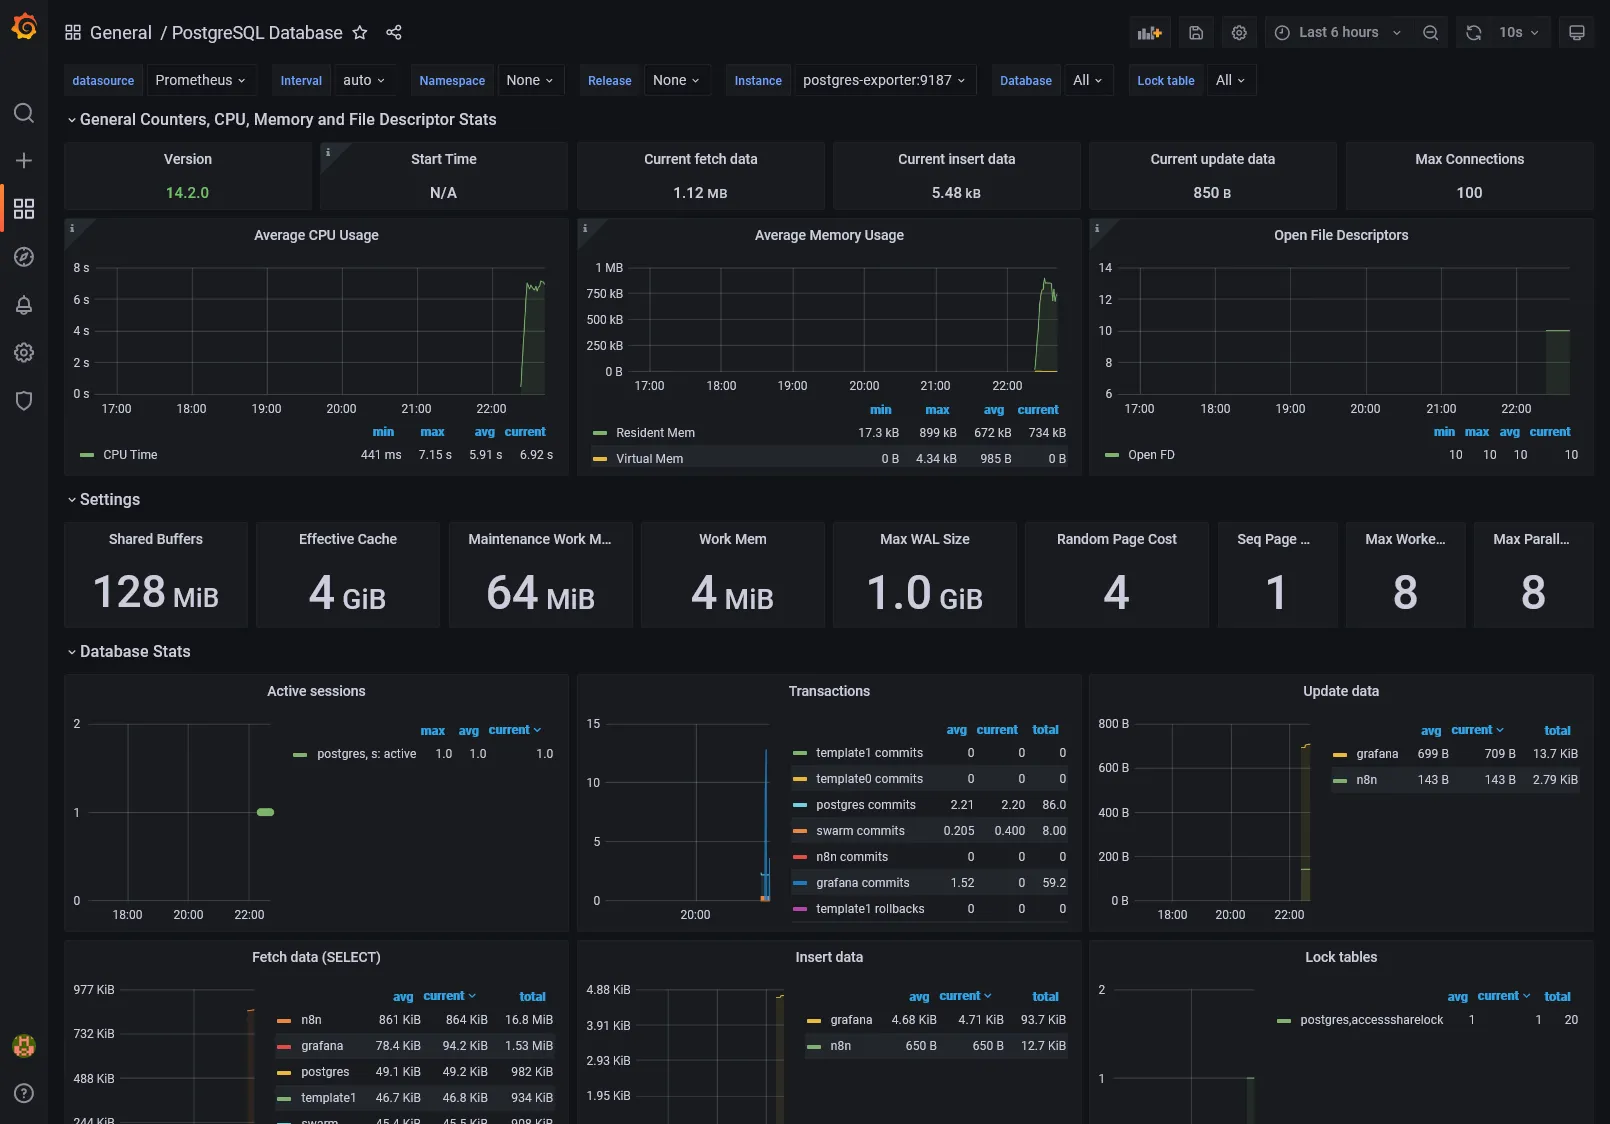
It’s simple just import the next dashboards, with Prometheus as data source, same as previous for Docker Swarm dashboard :
1860: For Node exporter7362: For MySQL exporter9628: For PostgreSQL exporter
Nothing more to do !
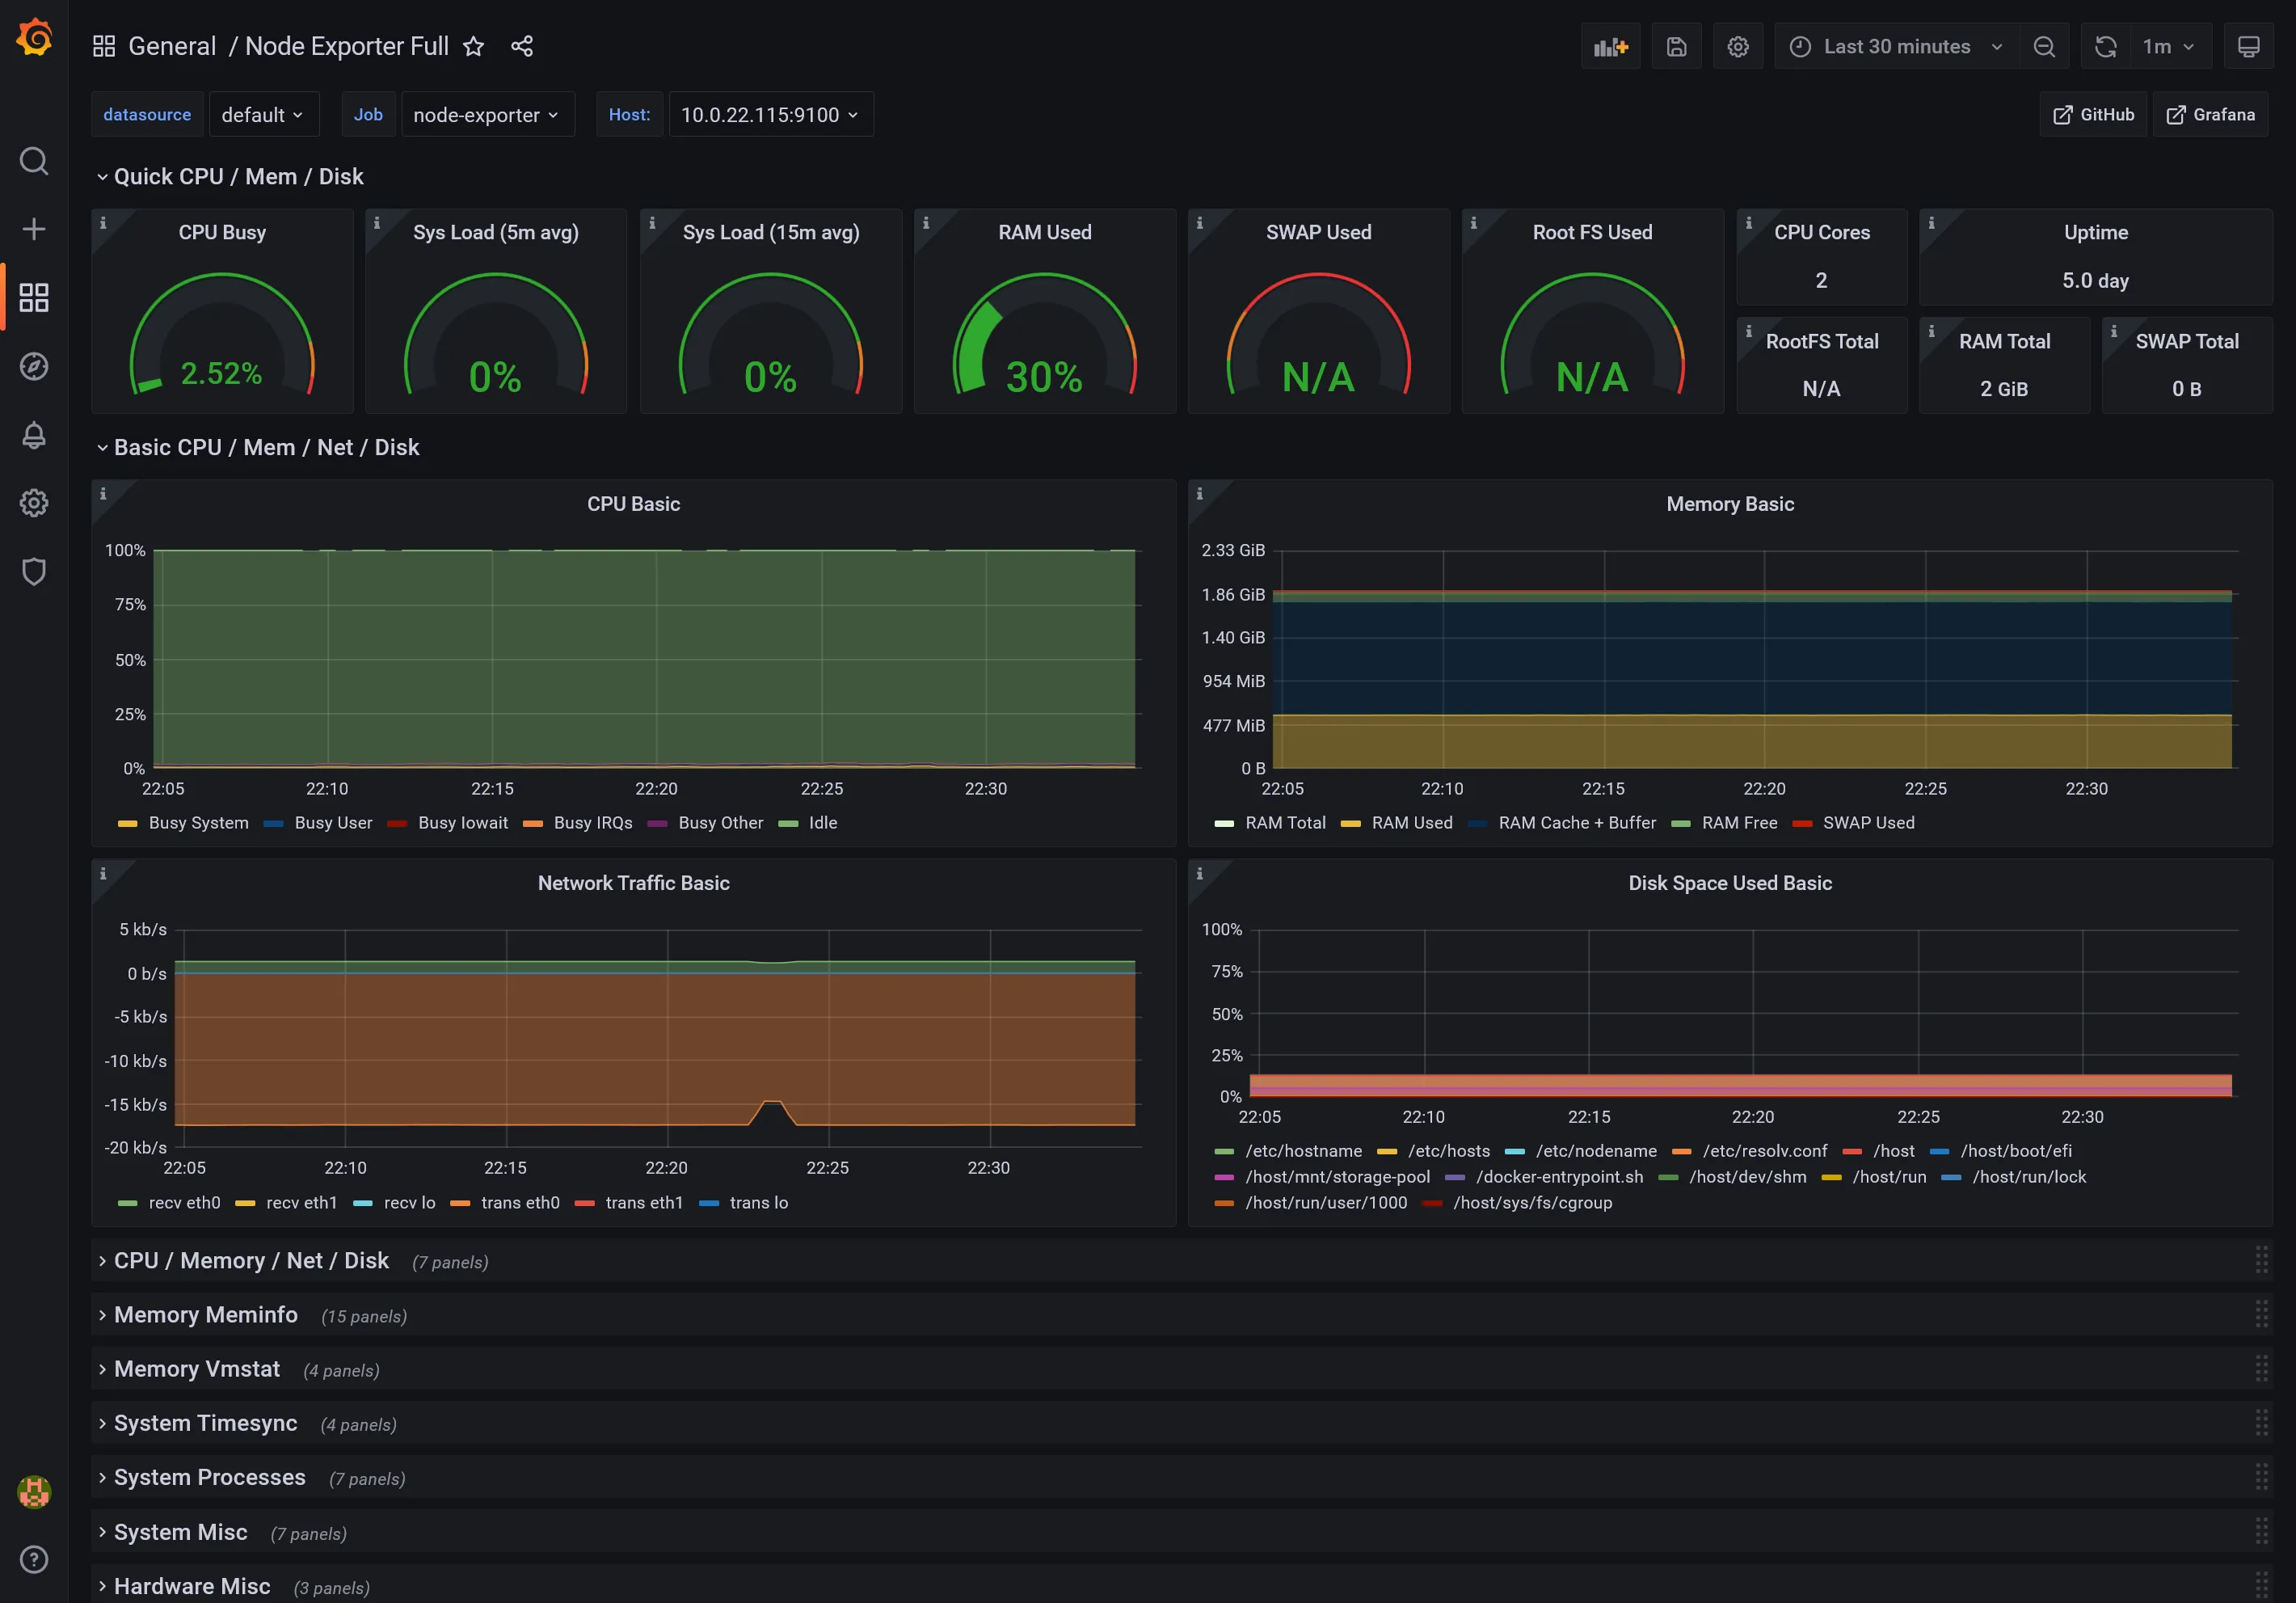
Node Dashboard
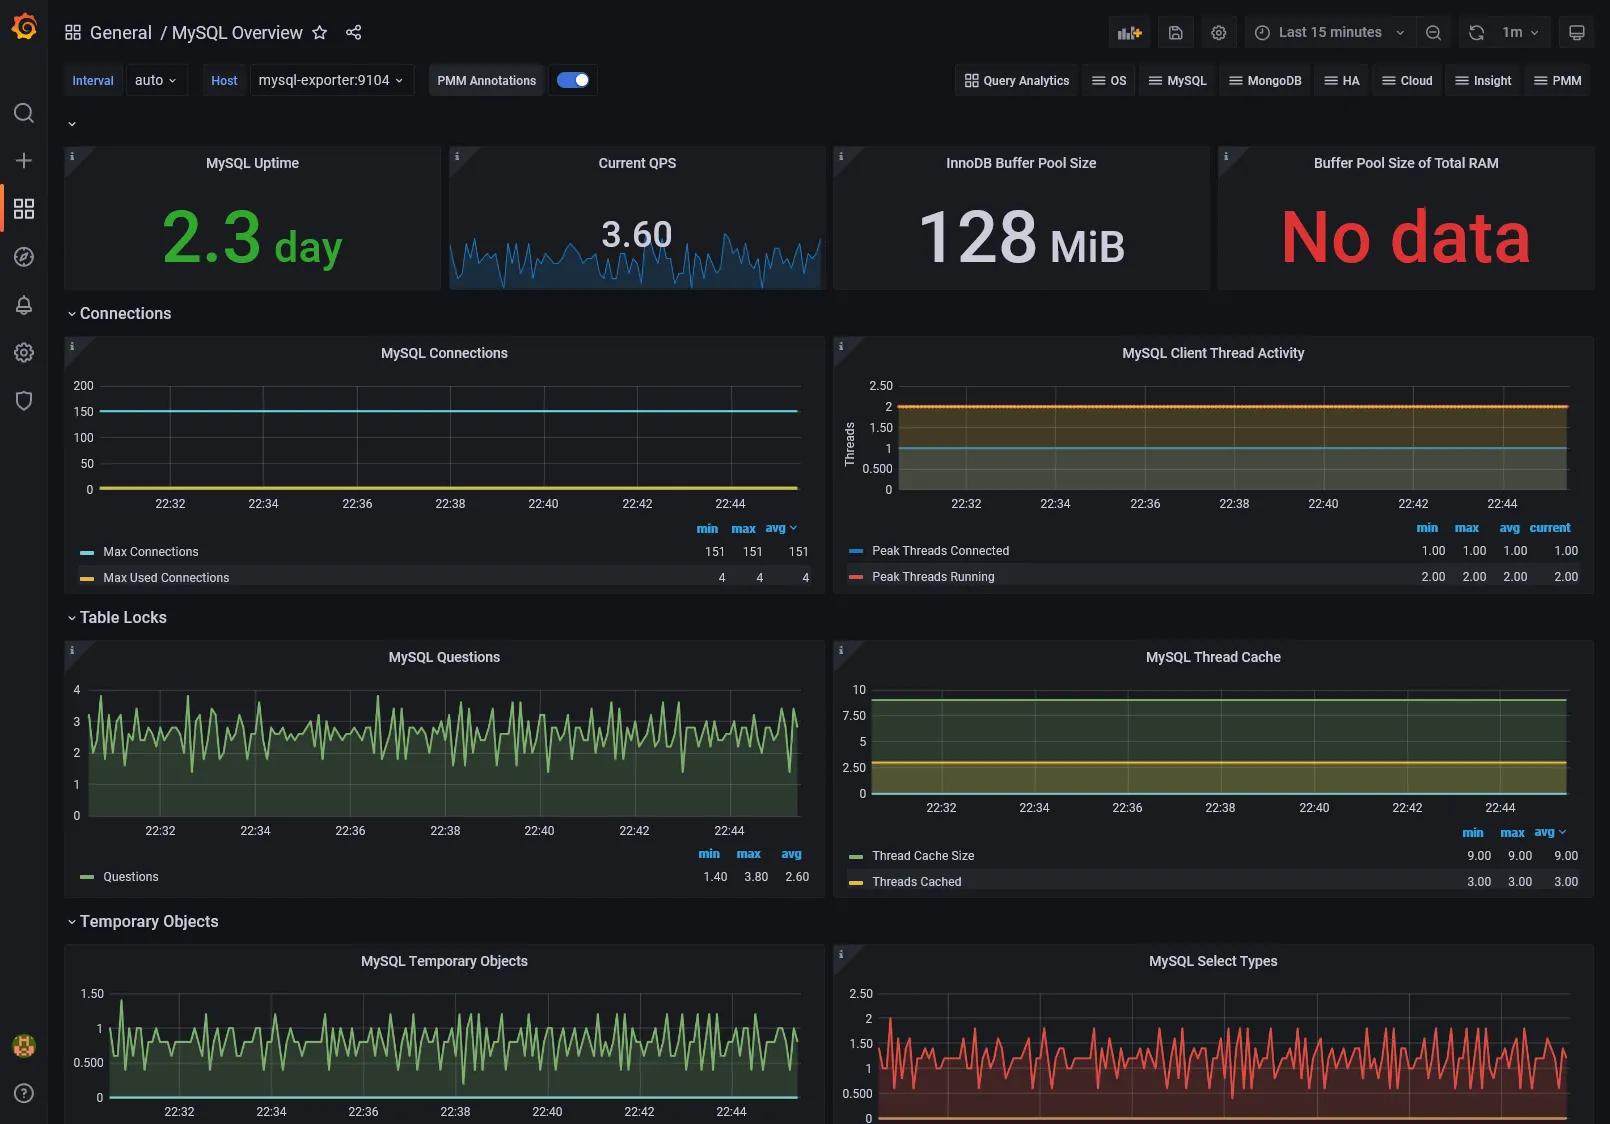
MySQL Dashboard
PostgreSQL Dashboard
4th check ✅
We’ve done all the monitoring part with installation of DB times series, exports and UI visualization.
What about logging and tracing, which are another essential aspects for production analyzing and debugging ? We’ll see that in the next part.