
Build your own cheap but powerful self-hosted cluster and be free from any SaaS solutions by following this opinionated guide 🎉
This is the Part VI of more global topic tutorial. Back to first part for intro.
Why centralized logs ?
A real production cluster should have centralized logs. Of course, we have some basic service logs viewer on Portainer, which shows the containers STDOUT, but :
- With more and more containers, it can be unmanageable
- Not very powerful to navigate, can be tedious with huge logs
Moreover, it’ll be nice if logs of data-01 services (MySQL, PostgreSQL, etc.) can be centralized too.
Why Loki ?
The common way to deal with this is to use ELK, but I’ll show you a better option which is far less resource demanding. Loki is a perfect viable option and perfectly integrated to Grafana. It works exactly like Prometheus in terms of architecture, but for logs :
- Loki as itself is a powerful database index search service like Elasticsearch, but optimized for logs
- Completely integrated to Grafana thanks to LogQL language, similar to PromQL for Prometheus
- Like Prometheus, we need to install many type of exporters in order to feed the Loki database.
The mains exporters are :
- Promtail which fetch local logs file based on some patterns, which is perfect for our
data-01managed server - Docker driver plugin which redirect all containers STDOUT to Loki.
Logs with Loki 📄
First, let’s install the main Loki service on data-01 (be sure to have unzip with sudo apt install -y unzip) :
curl -O -L "https://github.com/grafana/loki/releases/download/v2.4.2/loki-linux-amd64.zip"unzip "loki-linux-amd64.zip"chmod a+x "loki-linux-amd64"sudo mv loki-linux-amd64 /usr/local/bin/loki
wget https://raw.githubusercontent.com/grafana/loki/master/cmd/loki/loki-local-config.yamlsudo mkdir /etc/lokisudo mv loki-local-config.yaml /etc/loki/sudo mkdir /var/lib/lokisudo chown swarm:swarm /var/lib/loki
Edit /etc/loki/loki-local-config.yaml and change /tmp/loki by /var/lib/loki.
Then prepare the service :
[Unit]Description=LokiAfter=network.target
[Service]Type=simpleUser=swarmExecStart=/usr/local/bin/loki -config.file=/etc/loki/loki-local-config.yaml
[Install]WantedBy=multi-user.targetFinally, start the service :
sudo systemctl enable loki.servicesudo systemctl start loki.servicesudo systemctl status loki.serviceIt’s running !
Data logs with Promtail
It’s time to feed the Loki database with Promtail. First, let’s install the main service, always in data-01 (we don’t need it on docker hosts) :
curl -O -L "https://github.com/grafana/loki/releases/download/v2.4.2/promtail-linux-amd64.zip"unzip "promtail-linux-amd64.zip"chmod a+x "promtail-linux-amd64"sudo mv promtail-linux-amd64 /usr/local/bin/promtailCreate following file :
server: http_listen_port: 9080 grpc_listen_port: 0
positions: filename: /tmp/positions.yaml
clients: - url: http://data-01:3100/loki/api/v1/push
scrape_configs: - job_name: system static_configs: - labels: job: varlogs host: data-01 __path__: /var/log/*log - labels: job: mysql-logs host: data-01 __path__: /var/log/mysql/*log - labels: job: postgresql-logs host: data-01 __path__: /var/log/postgresql/*logThe above config is pretty itself explanatory. We declare the URL of Loki rest API endpoint, and a list of jobs which consist of simple regex where to tail log files. The positions.yaml avoid duplications by keeping the last line where the service stopped for each log file.
Then prepare the service :
[Unit]Description=PromtailAfter=network.target
[Service]Type=simpleExecStart=/usr/local/bin/promtail -config.file=/etc/loki/promtail-local-config.yaml
[Install]WantedBy=multi-user.targetFinally, start the service :
sudo systemctl enable promtail.servicesudo systemctl start promtail.servicesudo systemctl status promtail.serviceRecheck status after few seconds to confirm local var logs have been pushed successfully to Loki. Check sudo cat /tmp/positions.yaml for current tail status.
Note
You can eventually repeat all this Promtail install procedure for each Docker host if you want to have system logs for all nodes.
Docker hosts
Now we need to push all container logs to Loki. The official Docker driver is a nice way to do it for perfect integration. Install it on all docker hosts :
docker plugin install grafana/loki-docker-driver:latest --alias loki --grant-all-permissions
# ensure plugin is enableddocker plugin ls
Now we have 2 options, reedit all active docker stack YAML description for using the Loki driver instead of default docker json-file (boring), or downright consider it as default driver for all containers, which is relevant in our case, I think.
Create following file on each docker host :
{ "log-driver": "loki", "log-opts": { "loki-url": "http://data-01:3100/loki/api/v1/push", "loki-batch-size": "400" }}Then restart docker service sudo service docker restart.
And voilà, Loki is the default log driver for all containers. Note as you can still access your logs from Portainer.
Grafana explore and dashboard
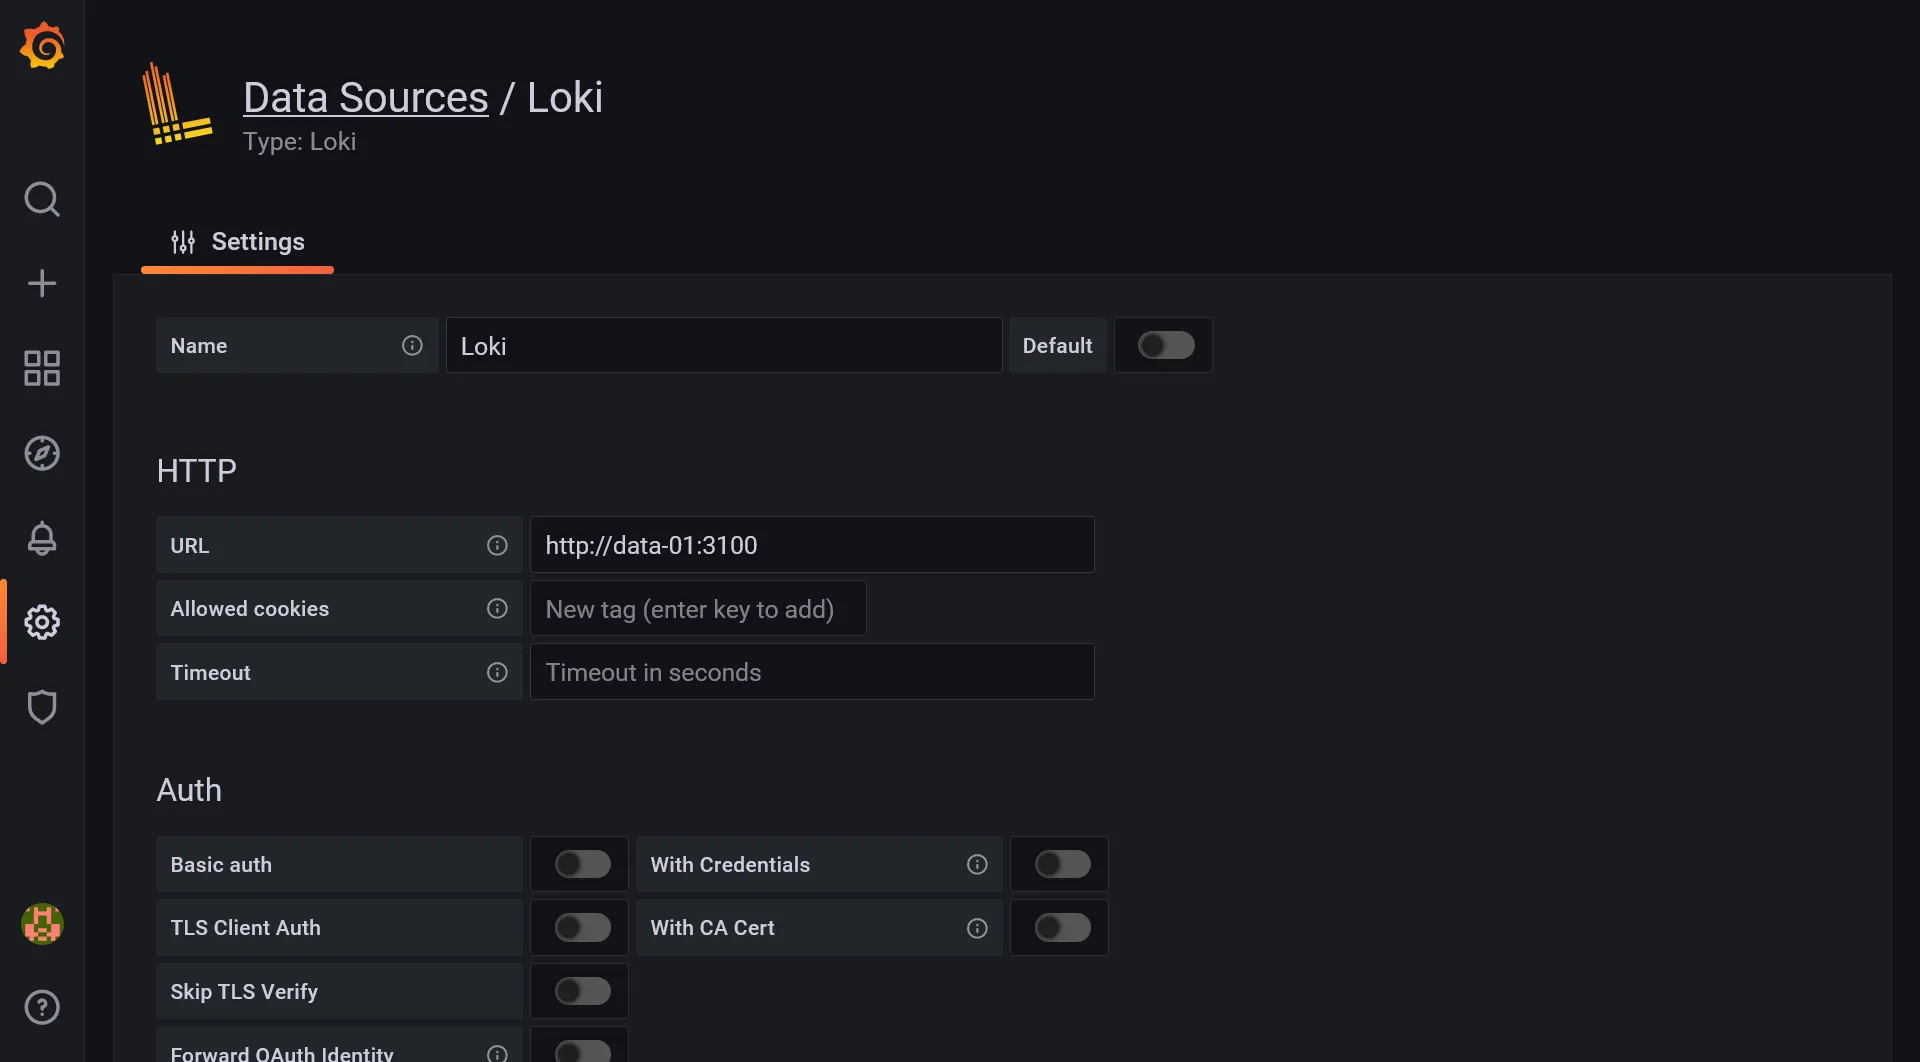
Now it’s time to set up our central logs dashboard. First add Loki as a new data source inside Grafana, similarly to previous Prometheus. Set http://data-01:3100 inside URL field and save it.
Then create a new Dashboard. No need to import this time :
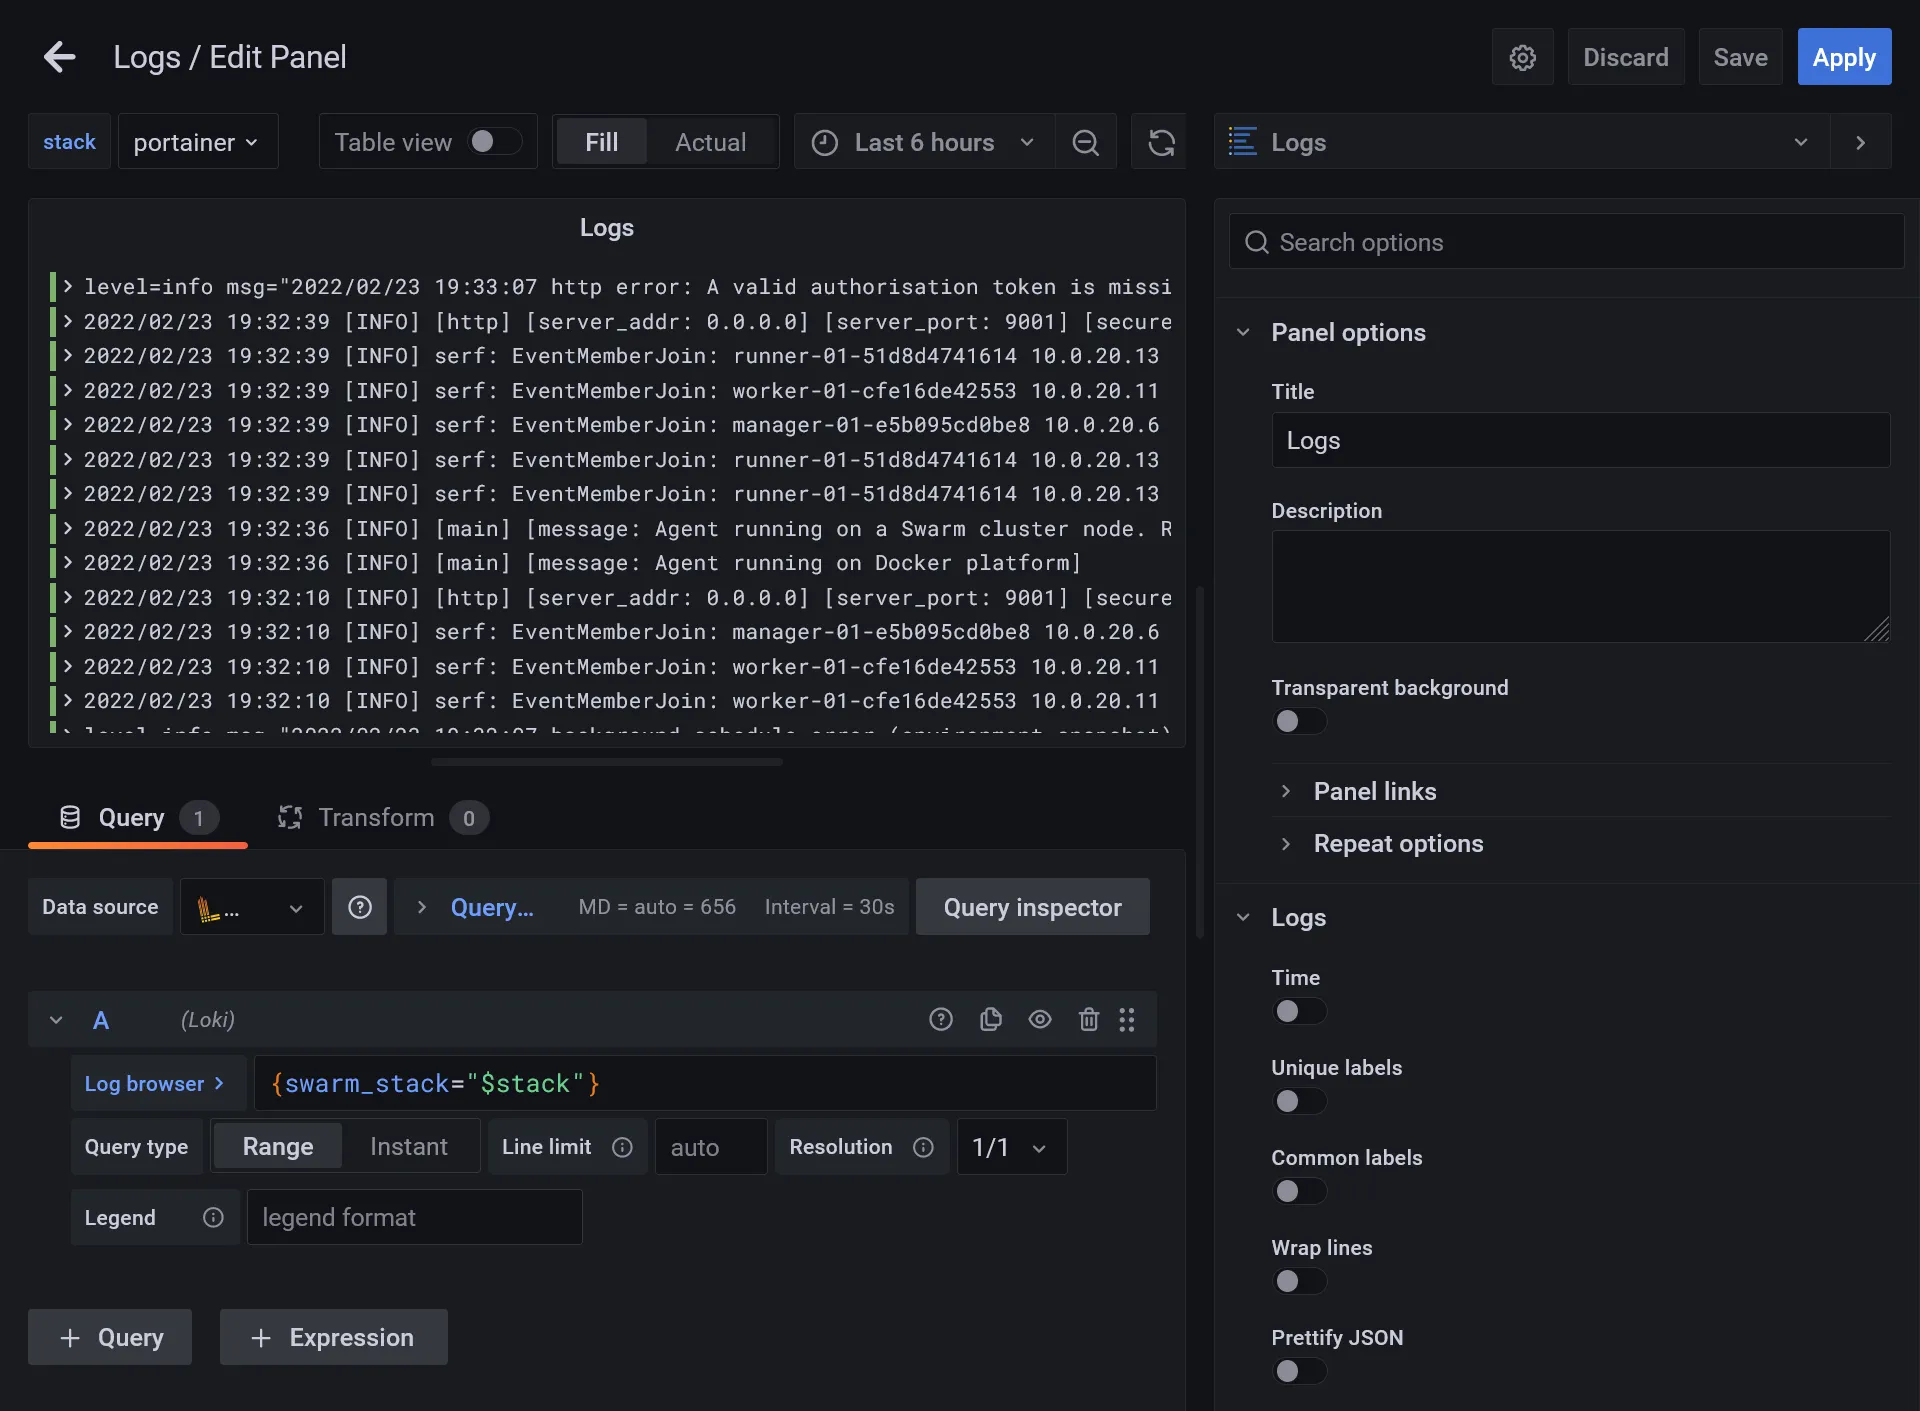
- Add a new panel
- Set logs as visualization type
- Select Loki in Data source
- Test some basic LogQL in Log browser in order to confirm all is working. Simply type
{It should have full autocomplete. You should have plenty of access logs when using{swarm_stack="traefik"}
After this primary testing, let’s use the power of Grafana with variables :
- Set
{swarm_stack="$stack"}"in log browser - Go to dashboard settings and enter the Variables section
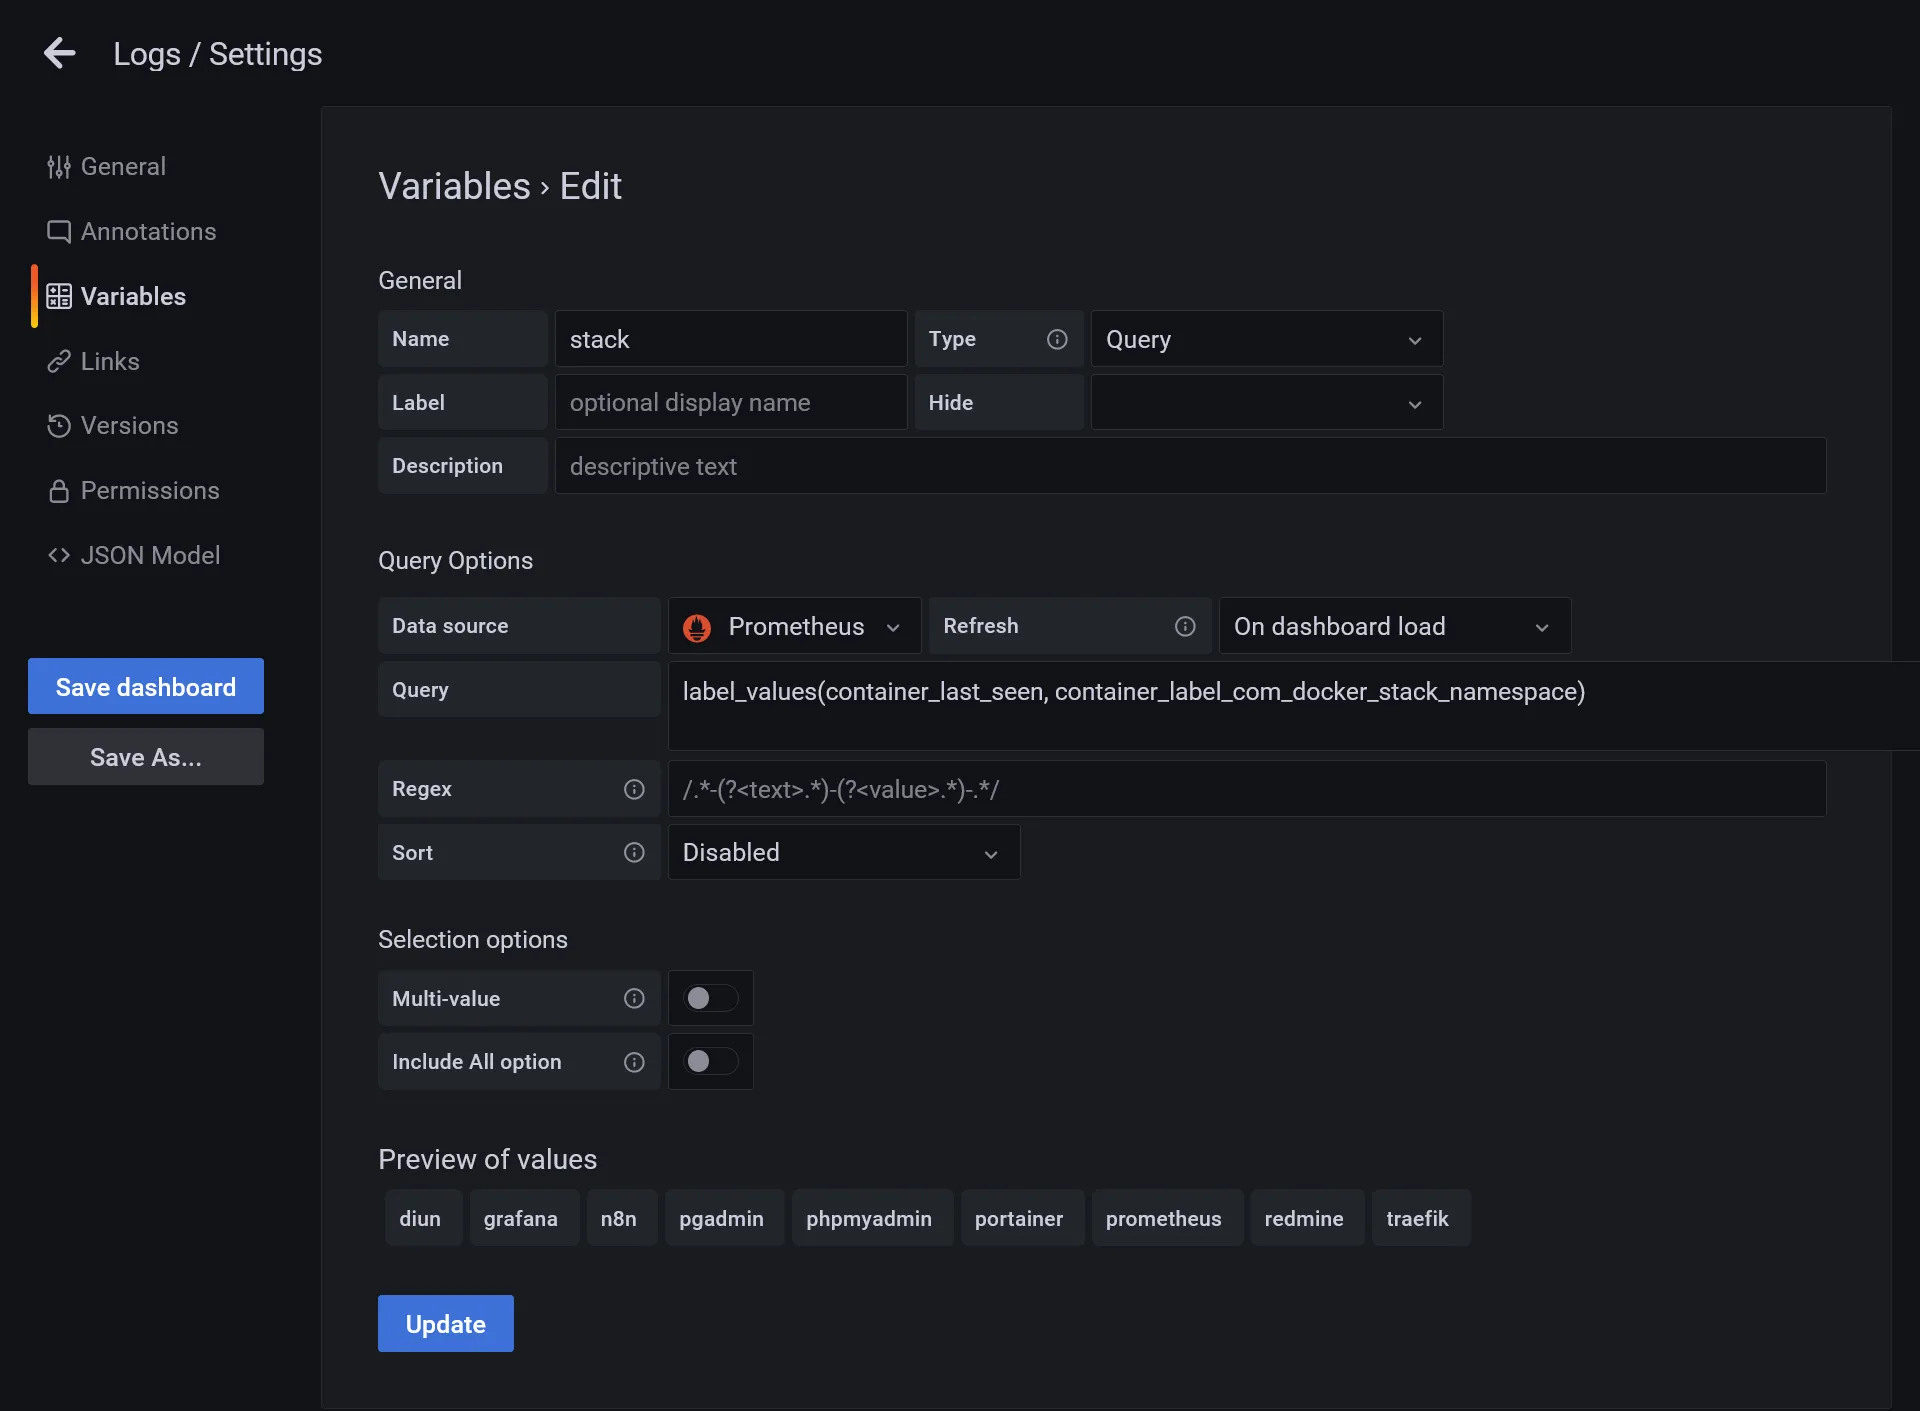
- Create a
stackvariable, select Prometheus as Data source, and insert following value inside Query field :label_values(container_last_seen, container_label_com_docker_stack_namespace) - It’s a PromQL which fetch all detected docker stacks, click on Update to confirm the validity of Preview of values that will be show up
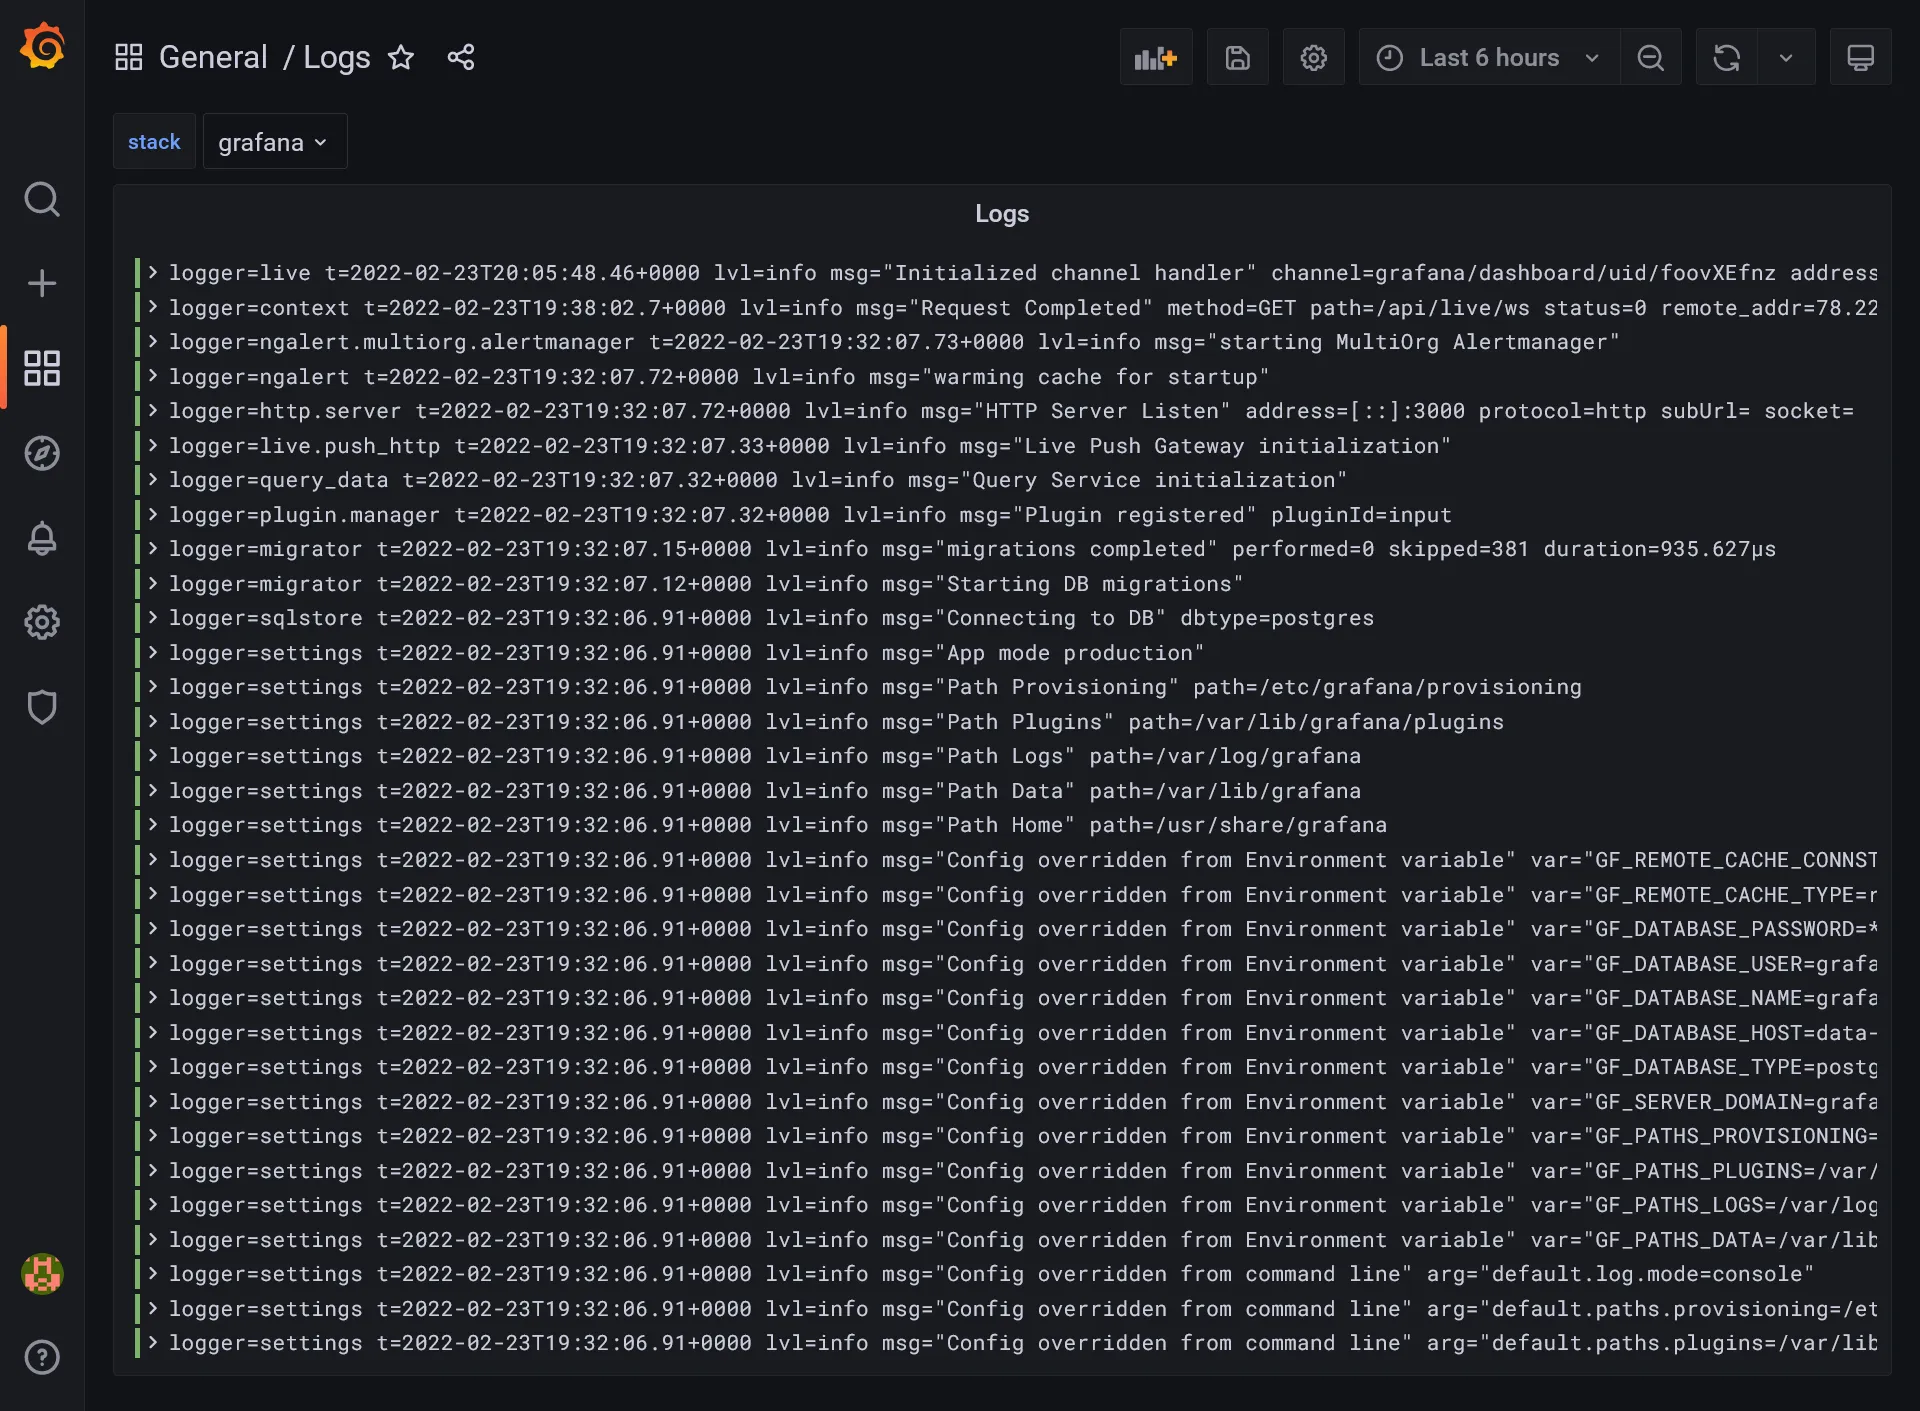
- Return to your panel editor. A new stack selector will appear in the top, allowing selection of the stack logs to show !
- Let’s apply for saving the panel and test the selector. The Panel should reactive with the stack selector.
- Save the dashboard.
Tracing with Jaeger 🔍
For further advanced development or any complex troubleshoot analysis, notably in a performance point of view, a tracing tool can be a real capital gain. It really helps for getting a high detail level of all code execution stacks, with granular time execution for each function call, like an SQL query executed from a backend stack, etc.
We’ll not discuss development side here, as it’s a subject that will be treated in next parts. But we’ll use Traefik as a perfect integration example.
It’s important to use a really efficient asynchronous tool for this task as it will receive potentially a huge amount of calls. A popular tracing tool nowadays is Jaeger, which is CNCF compliant. Jaeger is a flexible tool made of multiple little services that serves specific task.
Elasticsearch for Jaeger
Elasticsearch is the recommended production choice for trace storage. I don’t really like it because it can be pretty heavy to manage. But it should be okay for our usage with our 4 GB data-01, even with both MySQL and PostgreSQL (when minimal/personal usage…).
Let’s install it on data-01 :
wget -qO - https://artifacts.elastic.co/GPG-KEY-elasticsearch | sudo apt-key add -sudo apt-get install apt-transport-httpsecho "deb https://artifacts.elastic.co/packages/7.x/apt stable main" | sudo tee /etc/apt/sources.list.d/elastic-7.x.listsudo apt-get update && sudo apt-get install elasticsearchNote
Jaeger is not yet compatible with Elasticsearch 8…
Then allow remote network access by adding docker hosts :
#...network.host: 0.0.0.0#...discovery.seed_hosts: ["manager-01", "worker-01", "runner-01"]#...Before starting, let’s calm down Java legendary memory consumption by creating following file :
-Xms512m-Xmx512mThen start the service :
sudo /bin/systemctl daemon-reloadsudo /bin/systemctl enable elasticsearch.servicesudo systemctl start elasticsearch.serviceBe sure that Elasticsearch is correctly responding from docker nodes by doing curl http://data-01:9200.
As a bonus, expand above promtail config file for visualizing Elasticsearch logs in Grafana by adding a new job :
#... - labels: job: elasticsearch-logs host: data-01 __path__: /var/log/elasticsearch/*log#...Restart Promtail with sudo service promtail restart.
Jaeger cluster installation
It’s just a new jaeger docker stack to deploy :
version: '3.8'
services: collector: image: jaegertracing/jaeger-collector:1 volumes: - /etc/hosts:/etc/hosts networks: - private environment: SPAN_STORAGE_TYPE: elasticsearch ES_SERVER_URLS: http://data-01:9200 deploy: placement: constraints: - node.role == manager
agent: image: jaegertracing/jaeger-agent:1 networks: - private command: --reporter.grpc.host-port=collector:14250 deploy: mode: global
query: image: jaegertracing/jaeger-query:1 volumes: - /etc/hosts:/etc/hosts networks: - traefik_public environment: SPAN_STORAGE_TYPE: elasticsearch ES_SERVER_URLS: http://data-01:9200 deploy: labels: - traefik.enable=true - traefik.http.routers.jaeger.entrypoints=https - traefik.http.routers.jaeger.middlewares=admin-auth - traefik.http.services.jaeger.loadbalancer.server.port=16686 placement: constraints: - node.role == manager
networks: private: traefik_public: external: true| name | description |
|---|---|
collector | Acts as a simple GRPC endpoint for saving all traces in particular span storage, as Elasticsearch. |
agent | A simple REST endpoint for receiving traces, the latter being forwarded to the collector. An agent should be proper to a machine host, similarly as the portainer agent. |
query | A simple UI that connects to the span storage and allows simple visualization. |
After few seconds, go to https://jaeger.sw.dockerswarm.rocks and enter Traefik credentials. You will land to Jaeger Query UI with empty data.
It’s time to inject some trace data. Be sure all above Jaeger services are started through Portainer before continue.
Traefik integration
Edit Traefik config file and add following tracing option :
#...tracing: jaeger: samplingServerURL: http://tasks.jaeger_agent:5778/sampling localAgentHostPort: tasks.jaeger_agent:6831#...Then edit original Traefik stack file and add traefik service into jaeger network.
version: '3.8'
services: traefik: #... networks: - public - jaeger_private #...#...networks: public: jaeger_private: external: trueThen redeploy the stack by docker stack deploy -c traefik-stack.yml traefik. You’ll probably need to reexport the HASHED_PASSWORD variable environment. Note as you can eventually add the jaeger_private network directly from Portainer in traefik service instead of doing this in CLI.
Go back to Traefik dashboard and ensure Jaeger is enabled in Features section. Traefik should now correctly send traces to Jaeger agent.
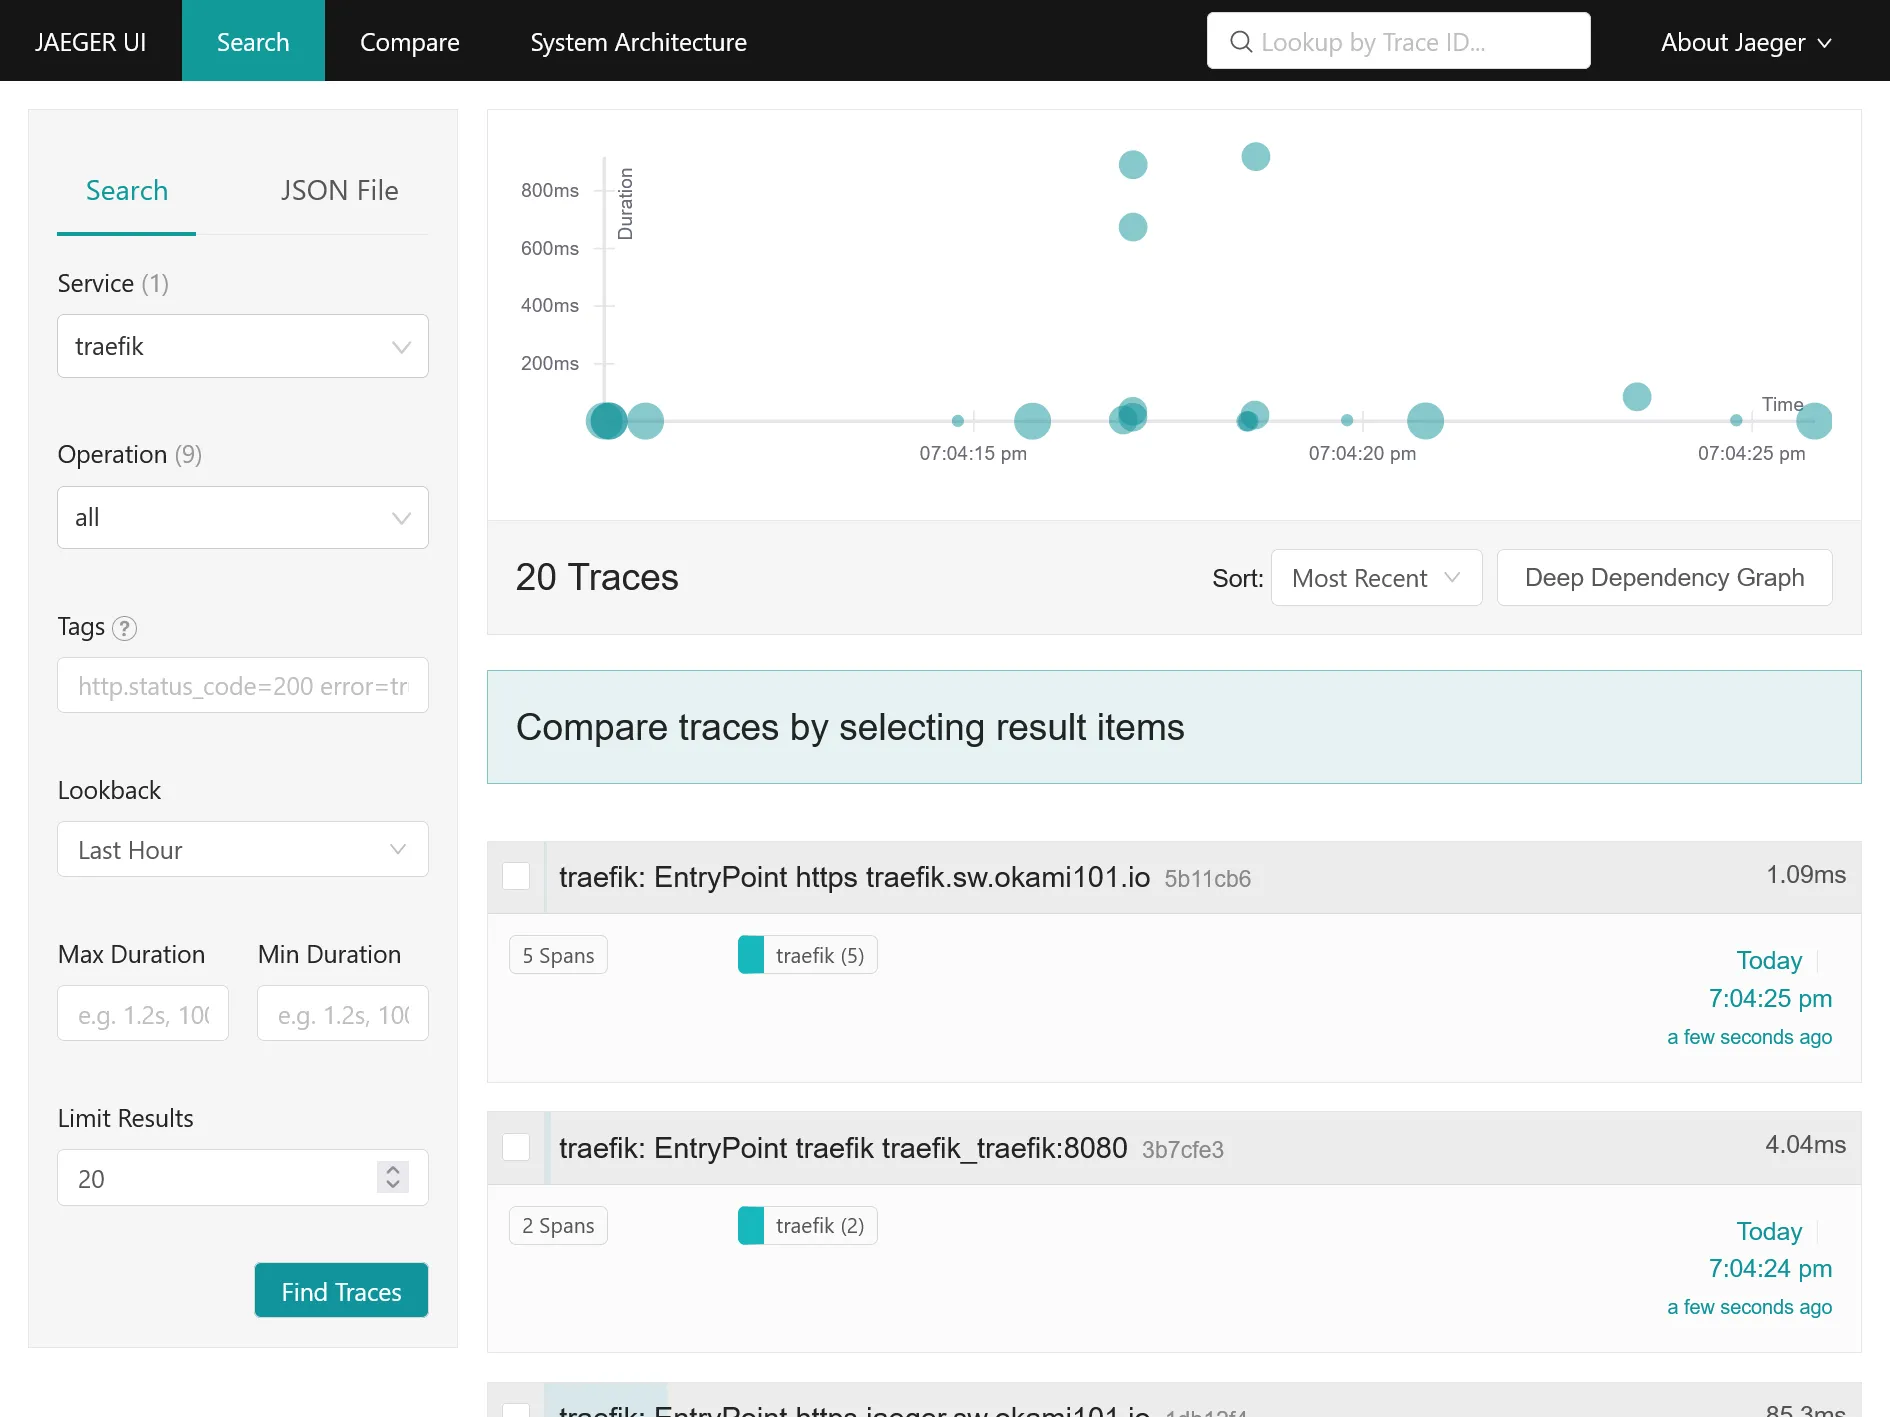
Go back now to Jaeger UI. You should have a new traefik service available. Click on Find Traces in order to get a simple graph a all traces, aka requests with duration !
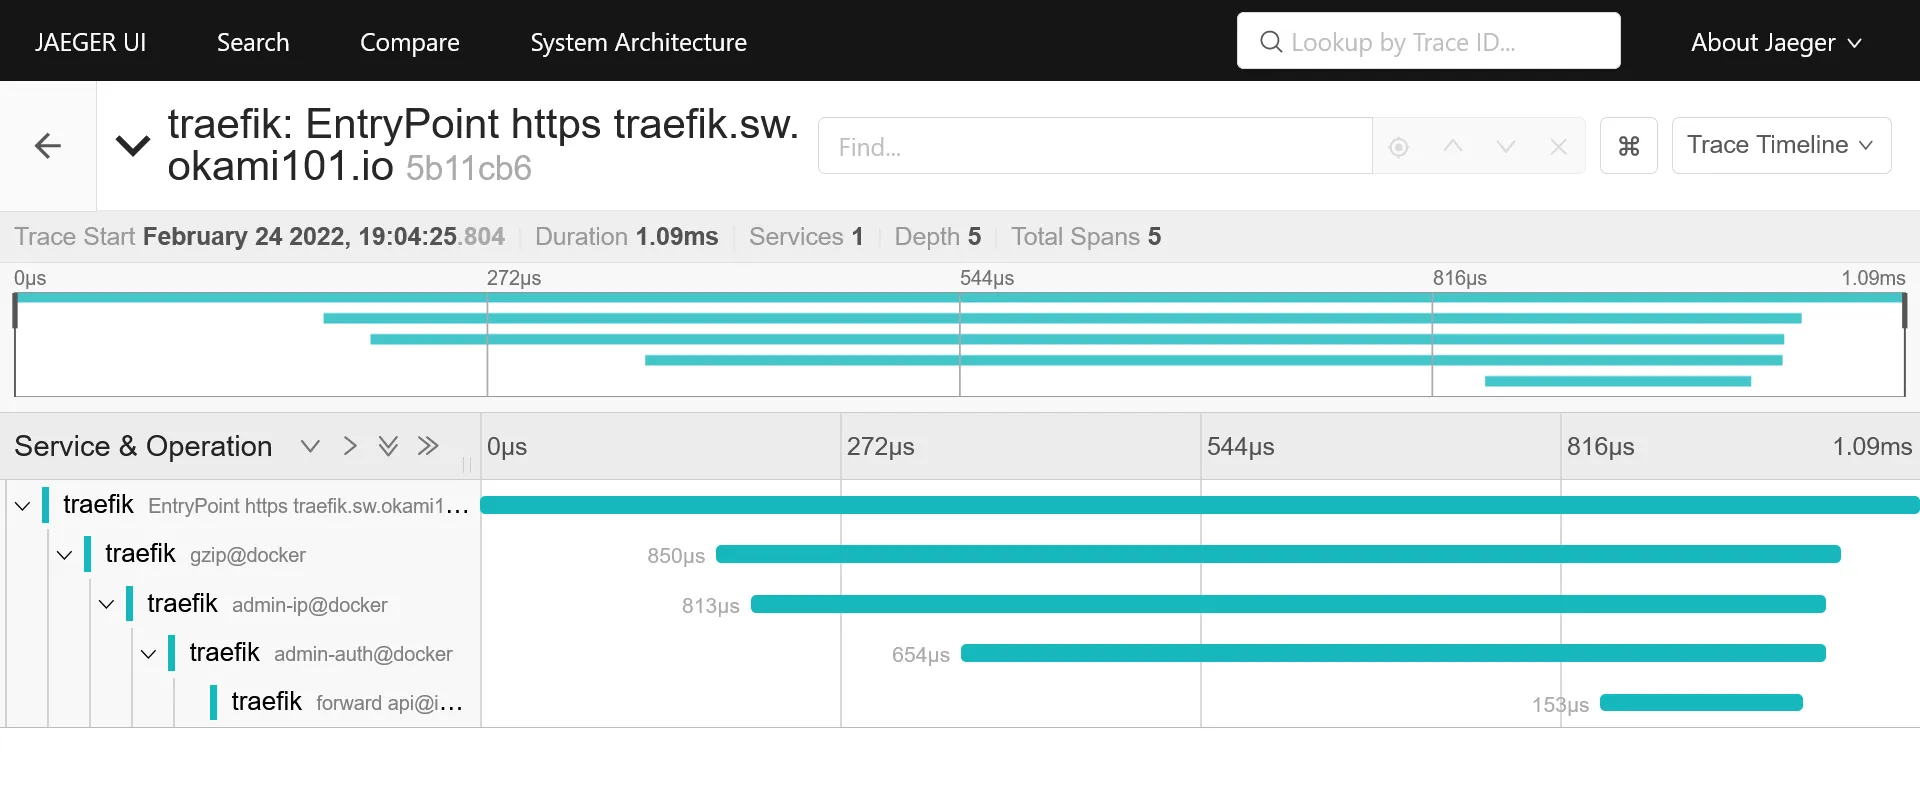
Detail view of request with duration time on each operation, aka traefik middlewares, docker container request process duration, etc.
5th check ✅
We’ve done all the logging part with complete centralized logging for cluster + data, as well as tracing.
Now it’s time to test a real case scenario usage for a developer perspective. We’ll see that in the next part.